As net health insurance premiums in the Marketplace have jumped by an average of nearly 60% nationally due to the expiration of federal subsidy enhancements, many consumers have been reassessing what coverage they can afford – or whether they can afford coverage at all.
One of the clearest signals of that growing anxiety isn’t coming just from enrollment data or policy analysis. It’s showing up in what people are searching for online, particularly when it comes to the cost of health insurance.
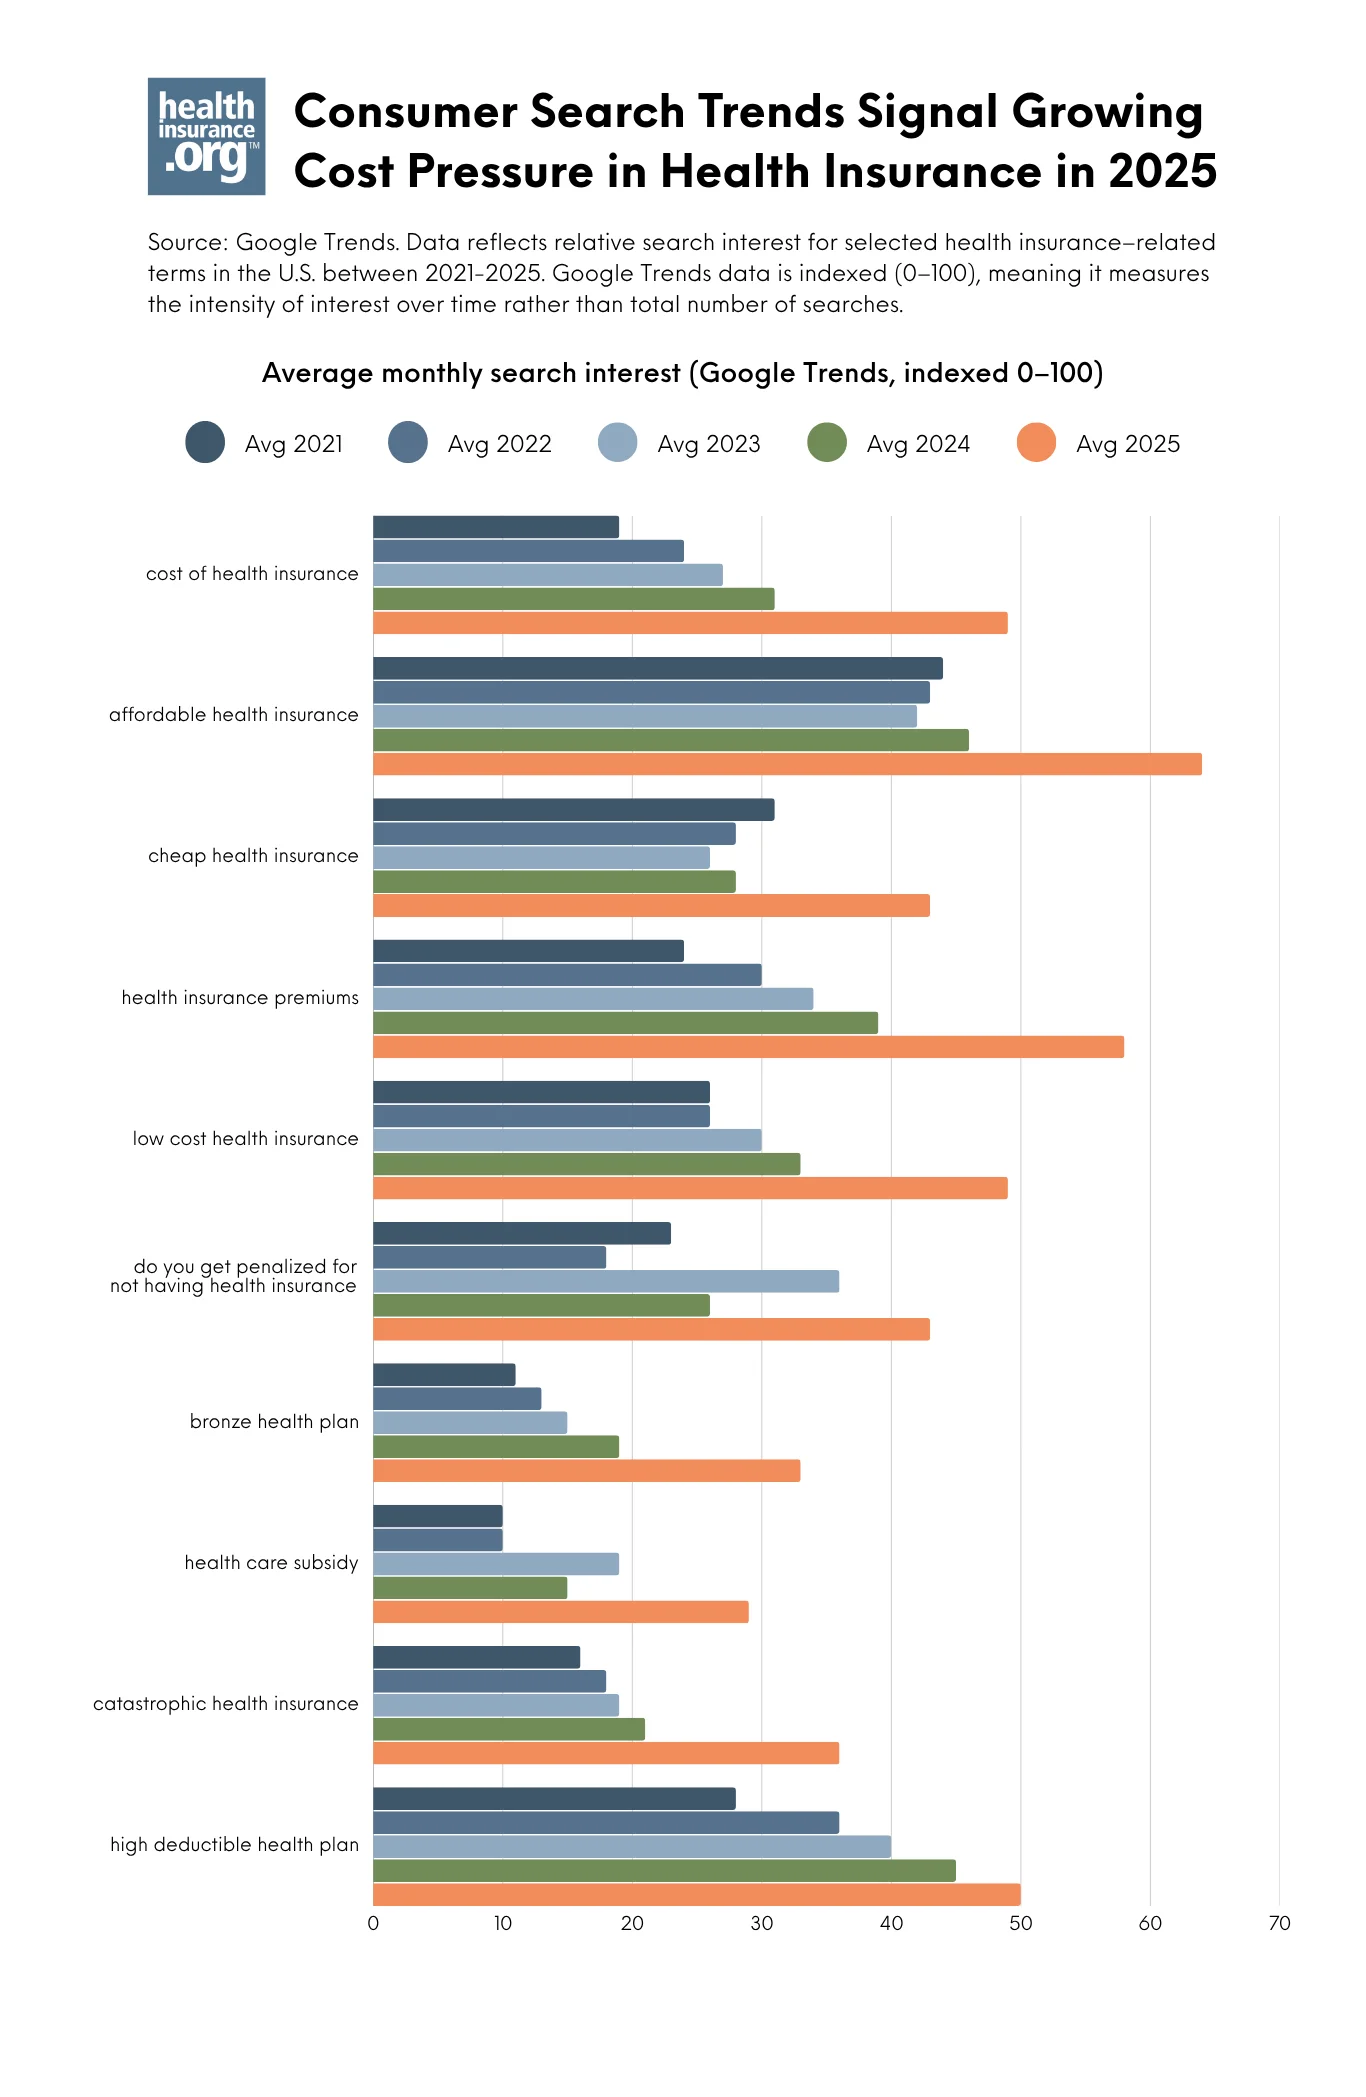
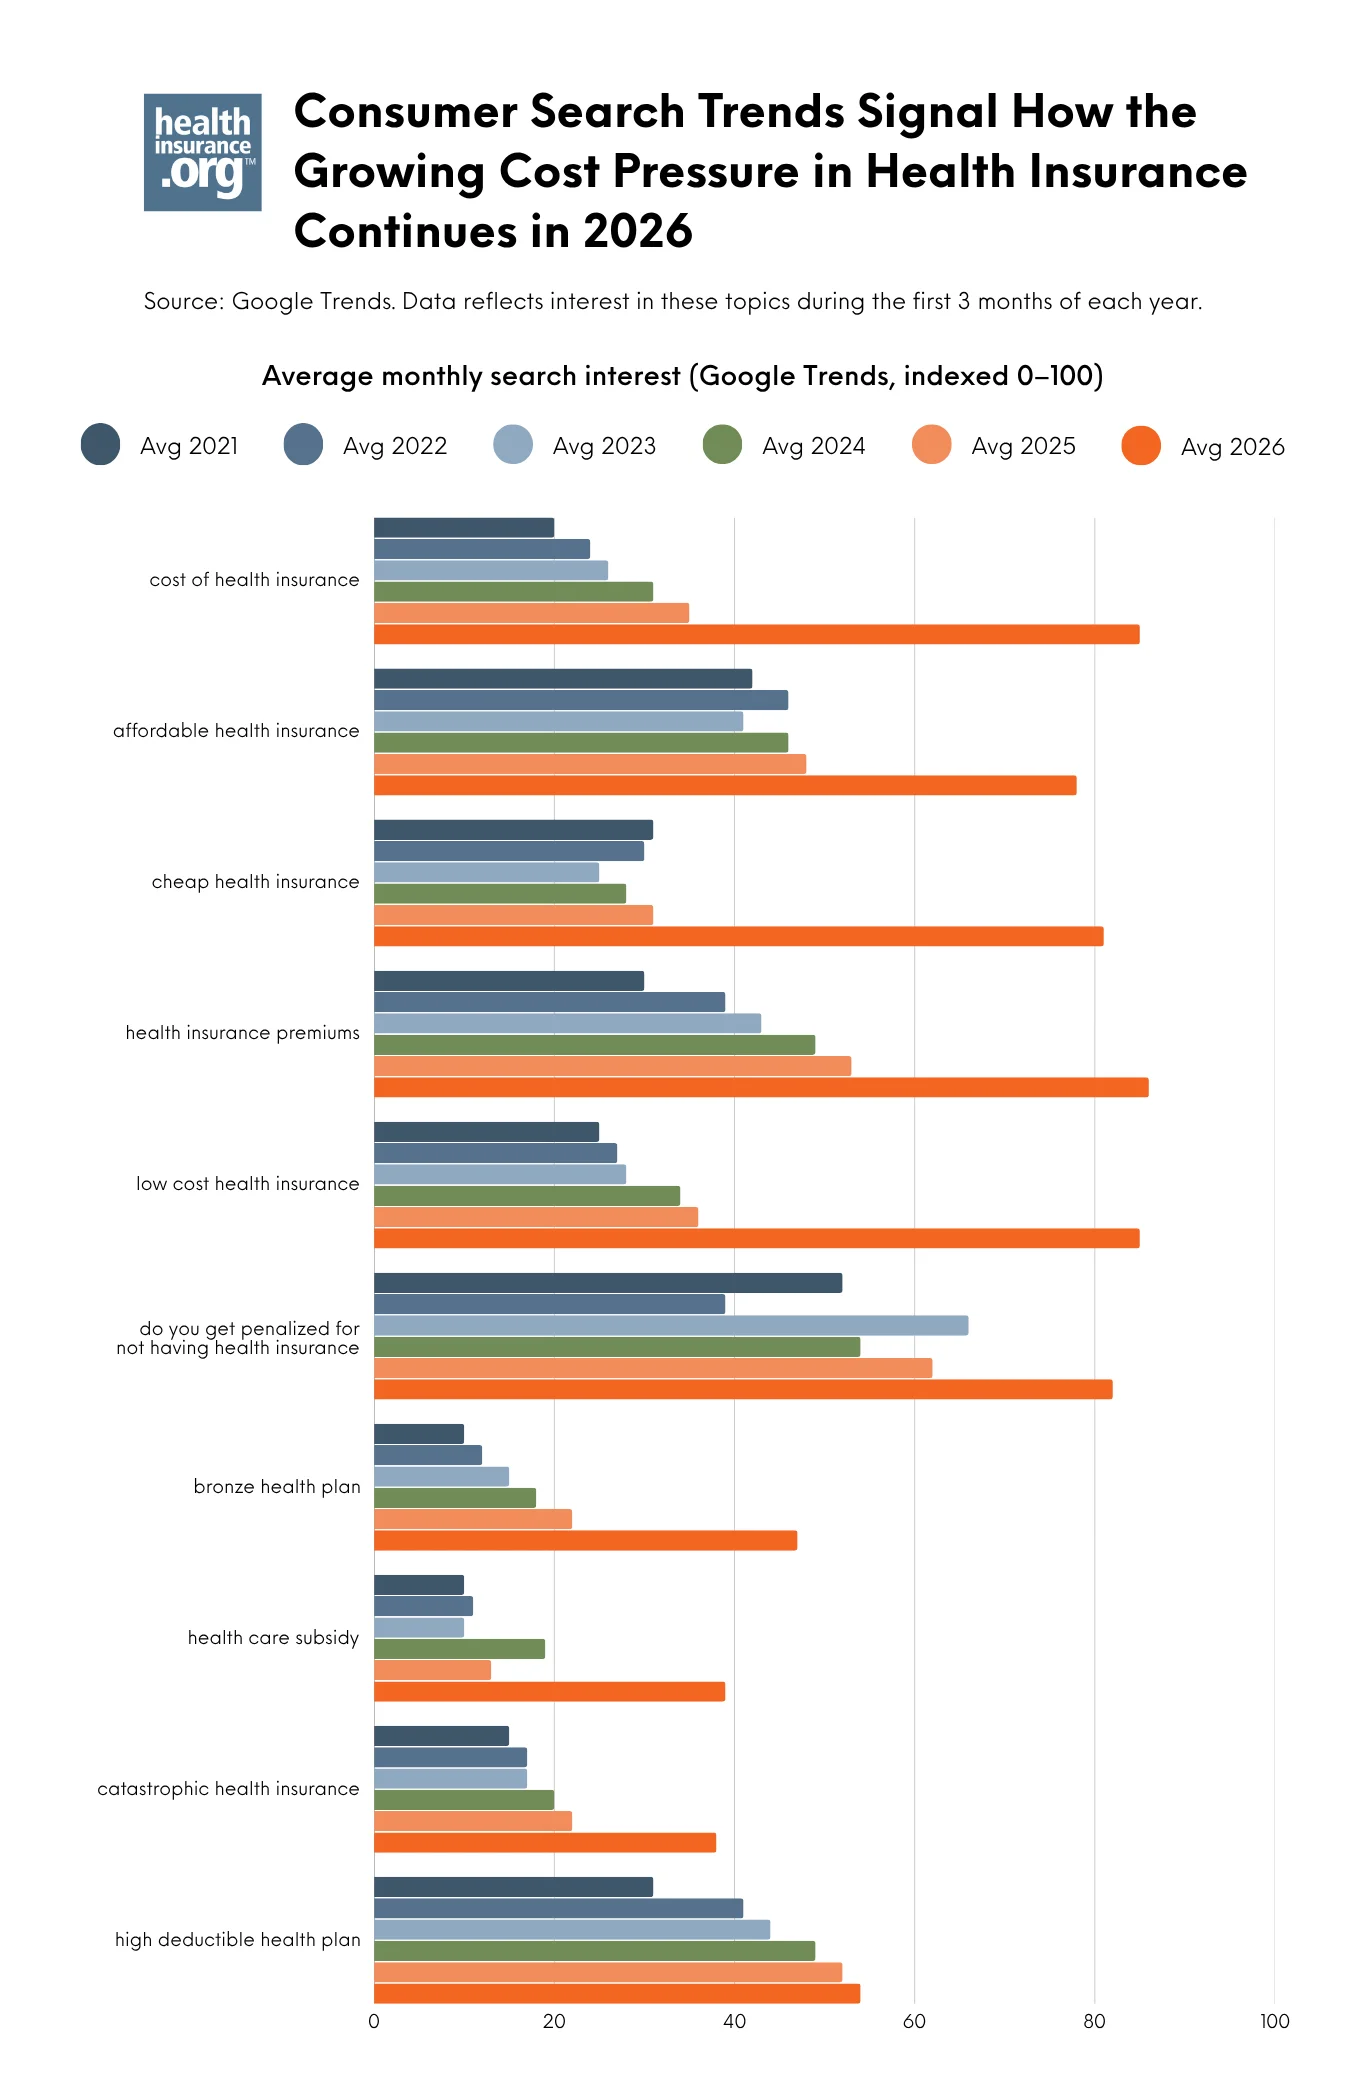
A healthinsurance.org analysis of more than five years of Google Trends data shows a sharp spike in affordability-related searches in 2025, followed by continued growth in early 2026. Searches related to the cost of health insurance, lower-cost coverage options, subsidies, and even the consequences of going without insurance surged as consumers grapple with rising costs.
Taken together, these trends suggest a meaningful shift in how consumers are approaching health coverage in today’s higher-cost environment.
Key findings at a glance
Google Trends data reflects relative search interest over time, offering a real-time view into what consumers are actively Googling. Between 2024 and 2025, search interest for:
- “cost of health insurance” increased about 54%
- “bronze health plan” increased about 75%
- “catastrophic health insurance” increased about 71%
- “cheap health insurance” and “low cost health insurance” surged 48% to multi-year highs
- “Do you get penalized for not having health insurance?” increased 65%.
These queries did not fade when open enrollment ended in January 2026. Between January and March, when many consumers faced their first premium payments of the year, search interest accelerated. Compared to previous winters, for example, search interest in “cheap health insurance” sharply increased over 160%.
See the findings below.
Why consumers’ interest in health insurance costs surged
During the open enrollment period for 2026 Marketplace health coverage, some clear trends emerged in conjunction with the expiration of federal premium subsidy enhancements: Fewer people enrolled, and more people selected Bronze plans, which have lower premiums but higher out-of-pocket costs. And even with those changes, average net (after-subsidy) premiums grew by 58%, going from $113/month in 2025 to $178/month in 2026.
So it’s not surprising that there has also been a significant increase in online search interest around health insurance costs and lower-premium coverage options in 2025 and 2026.
The cost of health insurance is causing consumer anxiety
In early 2026, search interest in “cost of health insurance” was more than double what it had been at the same time in 2025, and search interest in “health care subsidy” had nearly tripled. This isn’t surprising given the expiration of federal premium subsidy enhancements at the end of 2025, and the anxiety this may have caused for consumers.
If all Marketplace enrollees had renewed their 2025 plans for 2026, average net premiums were projected to increase by 114%. This caused significant sticker shock when people got their renewal notices last fall. Instead of renewing, many consumers opted to downgrade to a plan with a lower premium or drop their coverage altogether, resulting in net premiums “only” increasing by 58%.
The unfortunate reality is that most 2026 Marketplace enrollees were faced with higher premiums, higher out-of-pocket costs, or both. As a result, a recent KFF survey found that more than half of returning Marketplace enrollees are reducing their spending on food or basic household items so that they can afford their health insurance premiums and out-of-pocket costs.
Marketplace coverage ‘downgrades’ were widespread as consumers searched for ‘cheap health insurance’
Unsurprisingly, there has also been a spike in search interest related to Bronze and Catastrophic health plans, as well as “cheap” and “low-cost” health insurance. This is all indicative of the pressure that consumers are feeling when it comes to the monthly premiums they’re paying, and their efforts to find lower-cost coverage options.
Unfortunately, lower-cost options generally mean higher out-of-pocket costs. And that’s a best-case scenario that assumes a person continues to have ACA-compliant coverage. A person who switches from a Silver Marketplace plan to a Bronze or Catastrophic Marketplace plan will have higher out-of-pocket costs, but they’ll still have the ACA’s consumer protections, including coverage for pre-existing conditions and essential health benefits.
But we know that 1.2 million fewer people enrolled in Marketplace plans for 2026. Some of those people might have moved to other ACA-compliant coverage, such as an employer’s health plan. But some are likely uninsured altogether in 2026, while others might have opted for non-ACA-compliant insurance or even “coverage” that isn’t actually insurance, such as health care sharing ministry plans or Farm Bureau plans.
Bronze plans became much more popular with Marketplace enrollees in 2026, growing from about 30% of enrollments in 2025 to about 40% of enrollments in 2026.
At the same time, Silver plan selections dropped significantly, going from 56% of enrollments in 2025 to 43% in 2026.
And while Gold plan selections increased slightly, from 13% of enrollments in 2025 to 17% in 2026, it’s worth noting that in many cases this was still a coverage downgrade, if the person previously had a Silver plan with strong cost-sharing reductions.
This is because for those with income that doesn’t exceed 200% of the federal poverty level, a Silver plan provides much more robust benefits than a Gold plan. But in many states, Gold plans have lower premiums than Silver plans.
This helps to explain why some enrollees switched from Silver plans to Gold plans (or Bronze plans) in an effort to reduce premiums, despite giving up cost-sharing reductions to do so: Across all Marketplace enrollees, 51% were receiving CSR benefits in 2025, and that dropped to 37% in 2026. CSR benefits are only available on Silver plans, so consumers who are CSR-eligible are forfeiting that benefit if they select a non-Silver plan.
Searches for ‘catastrophic health insurance’
Despite the fact that the Trump administration took steps to expand access to Catastrophic plans in the fall of 2025, Catastrophic plans accounted for just 0.3% of all Marketplace plan selections in 2026, up only slightly from about 0.2% in 2025. Catastrophic plans aren’t available at all in 14 states, are only offered by some (but not all) Marketplace insurers in most other states, and can never be purchased with premium tax credits. So while they’re fully ACA-compliant, they still make up just a tiny sliver of Marketplace enrollment.
But it’s also worth pointing out that while “Catastrophic health insurance” has a specific definition under the ACA, consumers were using this term to describe cheap “bare bones” coverage long before the ACA. Search interest in “catastrophic health insurance” grew considerably in 2025 and 2026, and although some people using this search phrase might be looking for ACA-compliant coverage, others might be looking for lower-cost plans that aren’t ACA-compliant.
Increasing interest in high-deductible health plans
Search interest related to high-deductible health plans has been steadily climbing in recent years, reaching new highs in 2025 and early 2026. As is the case with “catastrophic health insurance,” the term “high-deductible health plan” (HDHP) has a specific definition. These plans are regulated by the IRS, and enrollees are allowed to make pre-tax contributions to a health savings account. But consumers who are doing online searches may or may not know that, and might simply be looking for lower-cost coverage.
In 2026, for the first time, all Bronze and Catastrophic Marketplace plans are considered HDHPs, meaning enrollees in these plans can make HSA contributions. For enrollees who are willing and able to do so, this could have significant tax advantages, and could explain why some people opted to switch to these plans, despite the higher out-of-pocket costs.
But having access to an HSA doesn’t necessarily mean that a person will utilize that option. Opening an HSA and making contributions to it are optional. And while the majority of people enrolled in employer-sponsored HDHPs receive HSA contributions from their employer, most people with HDHPs purchased in the individual market have to make their own HSA contributions.
How much will Marketplace enrollment drop in 2026?
Although Marketplace plan selections during open enrollment dropped by about 1.2 million people in 2026 compared with the year before, that doesn’t account for people who might not have paid their initial premiums to effectuate their coverage. Nor does it account for people whose coverage was terminated at the end of a grace period due to non-payment of premiums.
A Wakely analysis that covered about 80% of the individual market found that 86% of the people who selected a plan during the open enrollment period for 2026 (including those whose coverage was auto-renewed) paid their January premium. The other 14% includes some people whose coverage didn’t get effectuated, and others who were in a grace period and may or may not have paid their past-due premiums by the end of that grace period.
But overall, the Wakely analysis projects that “average enrollment in the individual market could shrink 17% to 26% in 2026 compared to 2025 average enrollment.”
A KFF analysis of returning Marketplace enrollees found that nearly one in five reported being unsure they’ll be able to continue to pay their monthly premiums throughout 2026. So it’s not surprising that online search interest in whether there’s a penalty for going without health insurance increased so much in 2025 and early 2026. Some people have already given up their coverage (plan selections during open enrollment dropped by about 1.2 million people compared with 2025), and others are unsure whether they’ll be able to maintain their coverage throughout 2026.
Although the Wakely analysis gives some good clues about early effectuated enrollment, it will likely be at least mid-2026 before we have official nationwide numbers from CMS in terms of how many people had effectuated Marketplace coverage as of February 2026. The effectuated enrollment number is always lower than the number of plan selections made during open enrollment.
But the first effectuated enrollment report won’t reflect the number of policies that lapsed at the end of March when their three-month grace period ended. Nor will it reflect people who were able to make their initial premium payments but weren’t able to continue to make those payments later in the year.
So as insurers start to prepare rates and plans for next year, it remains to be seen how many people will have individual-market coverage as we head into 2027.
A spike in searches about going without coverage
Consumer search interest in whether there’s a penalty for not having health insurance grew significantly in 2025 and the early part of 2026. This corresponds with a drop in Marketplace enrollment: 24.3 million people selected Marketplace plans for 2025, and that dropped to 23.1 million for 2026. So it makes sense that more people might want to learn more about the ramifications of going without health insurance.
Note: There hasn’t been a federal penalty for being uninsured since 2018, but DC and four states do impose a penalty.
What to do if you’re struggling with health insurance costs
If health insurance feels unaffordable in 2026, you’re certainly not alone. Read more about what to do if you’re feeling premium sticker shock, and what you can do if you can’t afford health insurance and aren’t eligible for Medicaid.
Consumer search trends signal growing cost pressure in health insurance