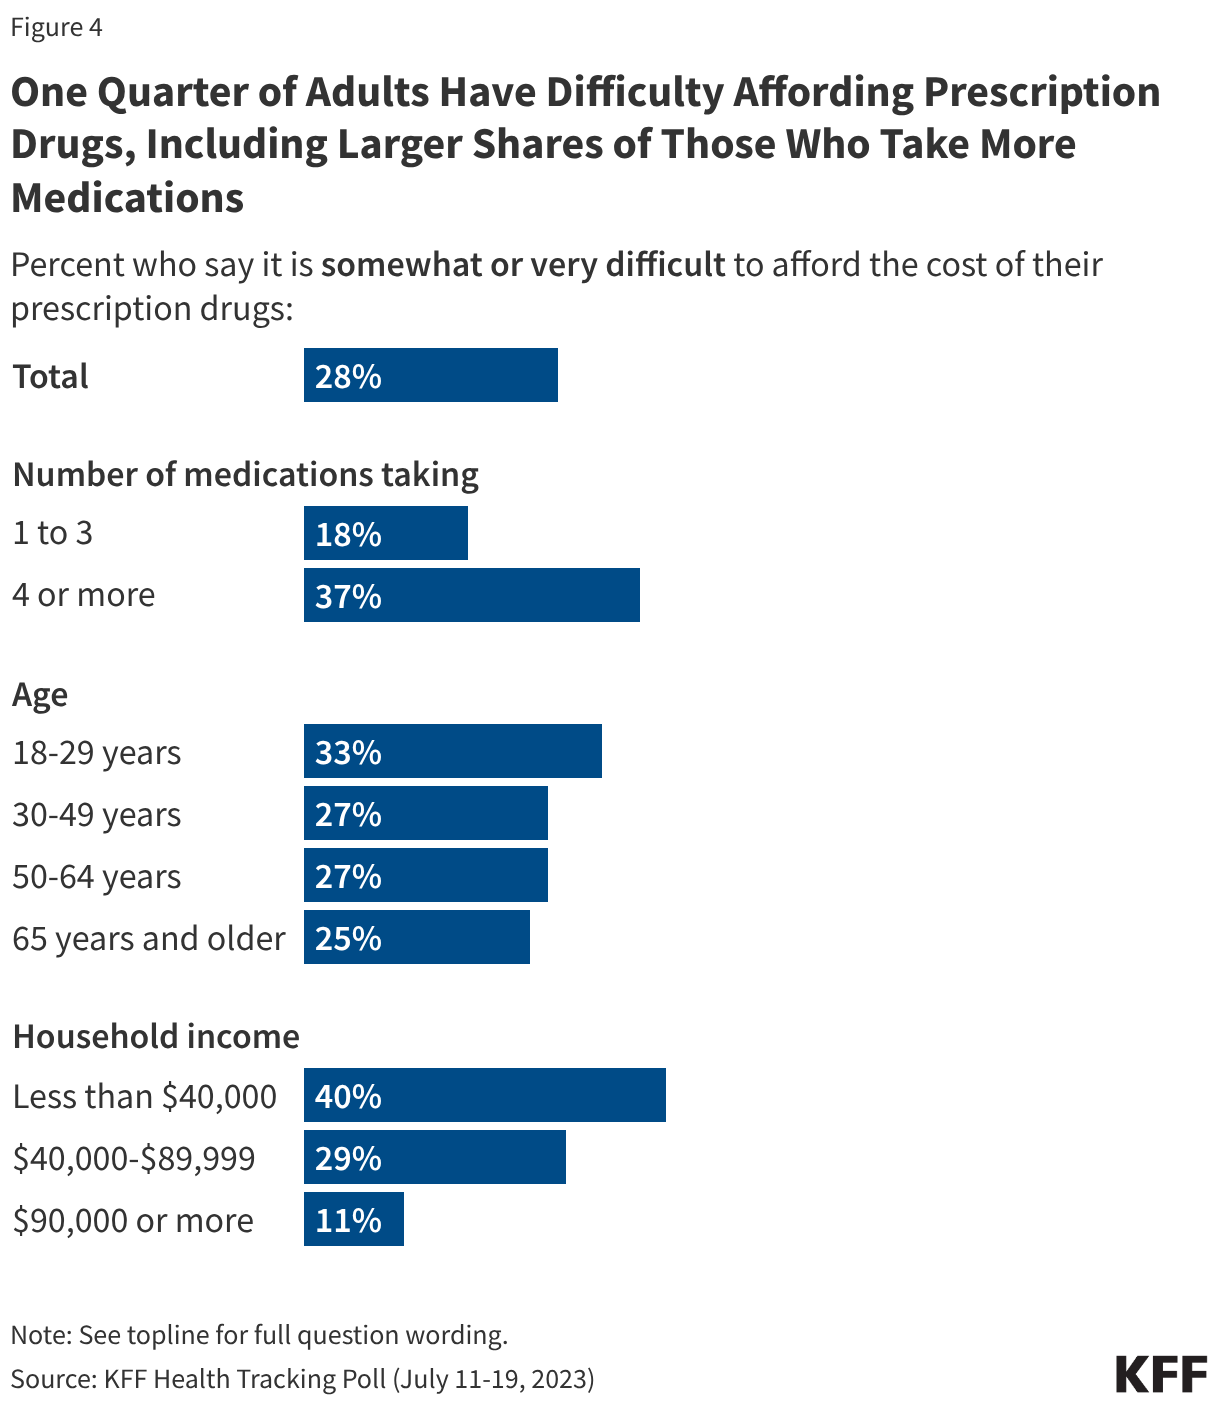
Many Americans face significant challenges affording their medications, including adults who take more medications or have lower incomes. KFF polling shows these challenges have grown more acute over the years. While about two-thirds (65%) of adults overall say it is “very” or “somewhat” easy to afford their prescription drug costs, affordability is a bigger issue for those who are currently taking four or more prescription medicines. Nearly four in ten (37%) of those taking four or more prescription drugs say they have difficulty affording their prescriptions, compared with one in five (18%) adults who currently take three or fewer prescription medications. Adults with an annual household income of less than $40,000 are also more likely than adults with higher incomes to report difficulty affording their prescription medications.
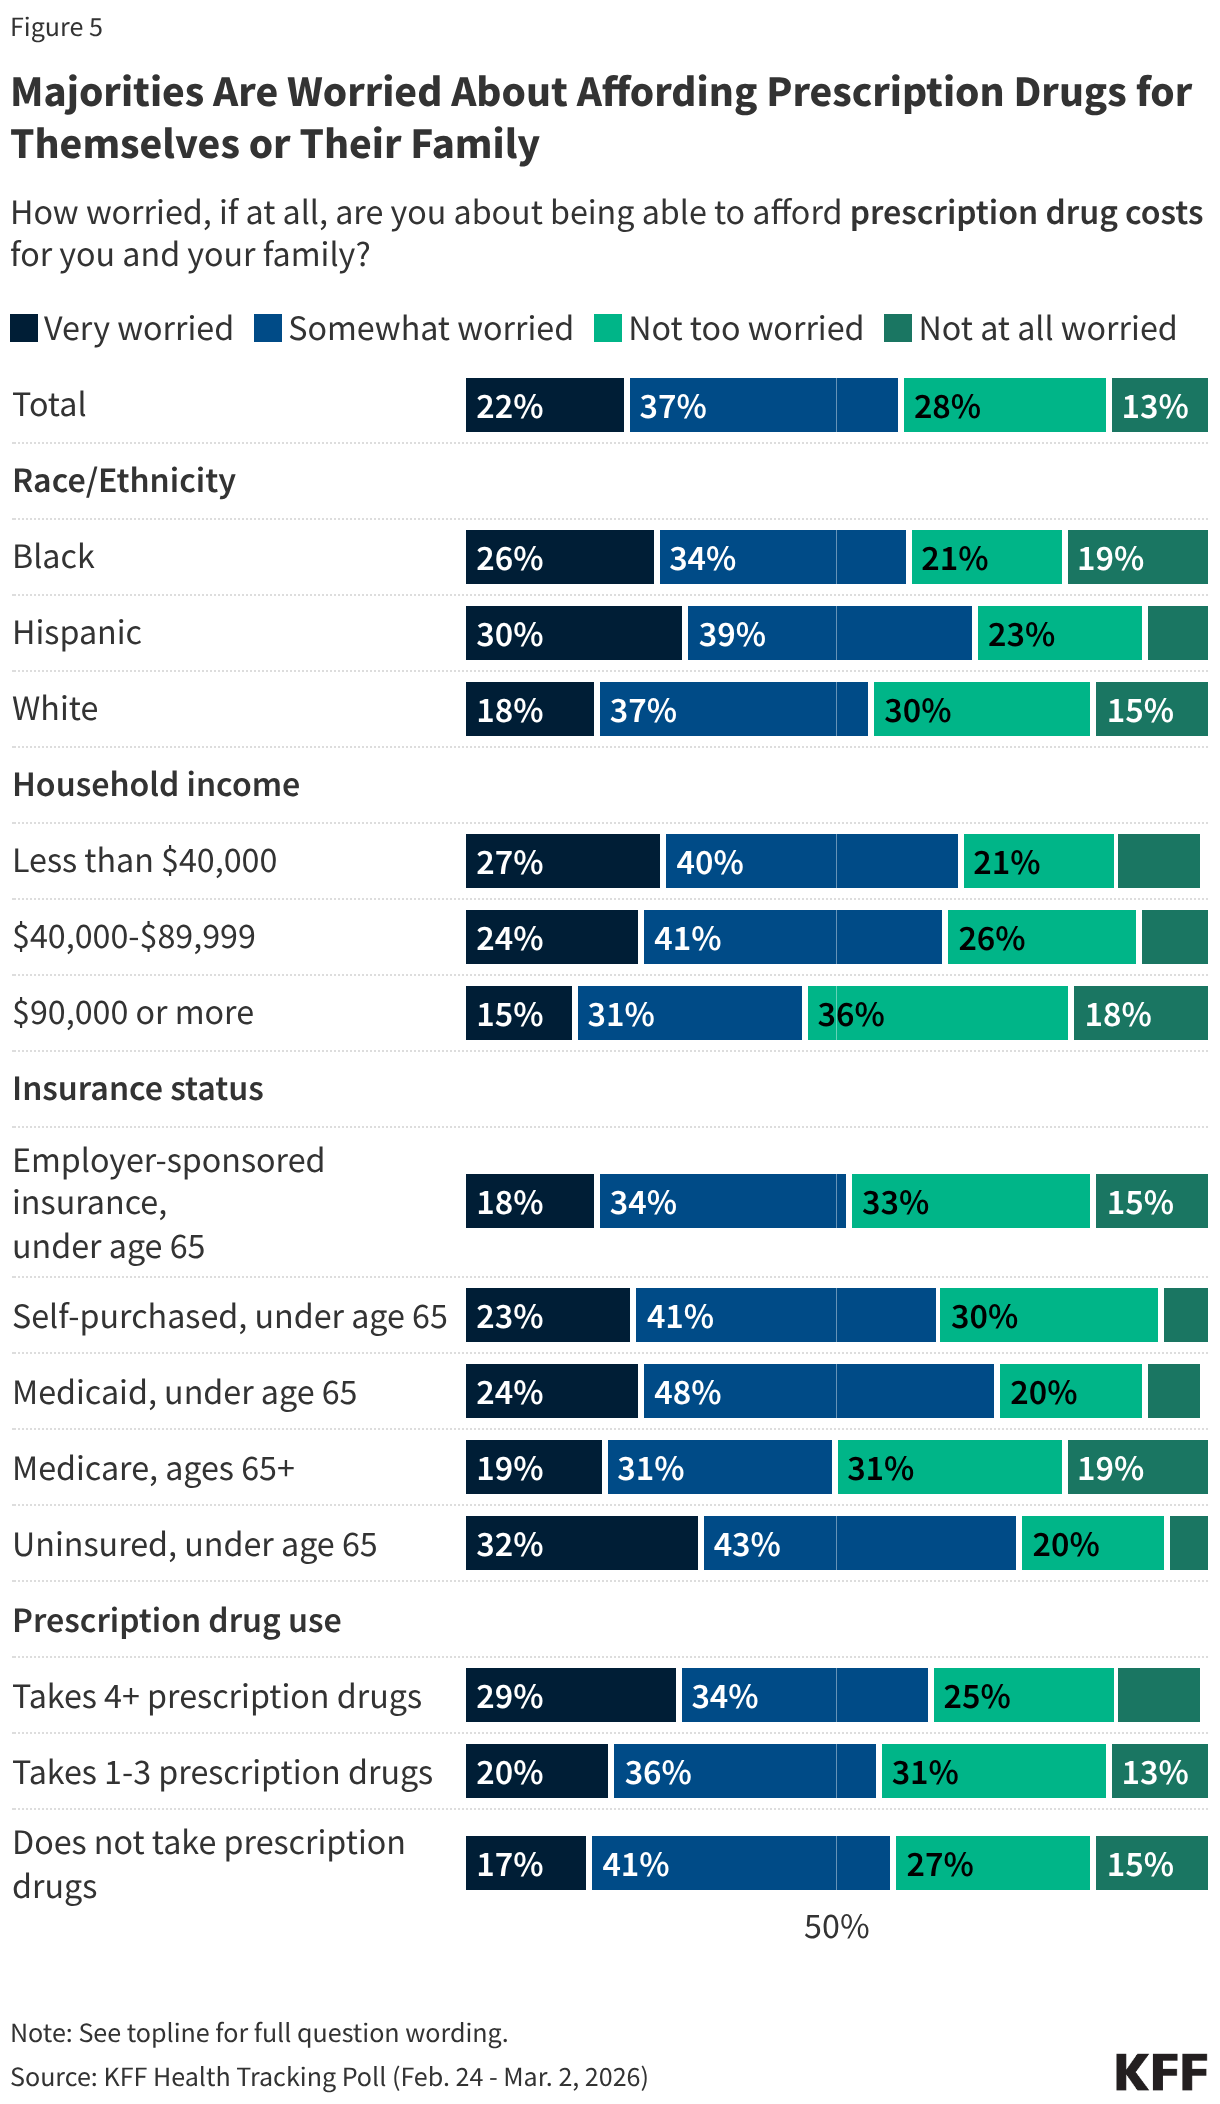
Overall, about six in ten adults say they are worried about being able to afford prescription drug costs for themselves or their families (59%), including about one in five (22%) who are “very worried.” Worry varies by insurance status, household income, race, and ethnicity. Substantial shares of uninsured adults under age 65 (32%), Hispanic adults (30%), Black adults (26%), and adults in households with annual incomes less than $40,000 (27%) say they are “very worried” about affording their prescription drug costs.
Among adults who take four or more prescription medications, about two-thirds (64%) report worrying about affording their medications, including about three in ten (29%) who are “very worried.” However, worry is not limited to those who take at least four medications. Most adults who take fewer prescriptions (1 to 3) worry about being able to afford their medications (56%). Even among adults who do not currently take any prescriptions themselves, a majority (57%) are “very” or “somewhat worried” about affording prescription medications, perhaps reflecting concerns about future needs or the prescription drug costs of family members.
Notably, about one in five (19%) Medicare enrollees say they are “very worried” about affording their prescription drug costs. Although older adults are more likely to take more prescription medications than younger adults, the vast majority of Medicare beneficiaries are enrolled in Medicare Part D plans, giving them prescription drug coverage that has improved with recent policies in the Inflation Reduction Act of 2022.
About one in four (24%) Medicaid enrollees under age 65 say they are “very worried” about affording their prescription drug costs. Medicaid provides comprehensive access to prescription drugs for eligible adults, with out-of-pocket costs limited to nominal amounts, which helps adults avoid cost-related prescription medication rationing or delays. However, while prescription out-of-pocket costs in Medicaid are limited, even low amounts may still be prohibitive for low-income families with Medicaid.
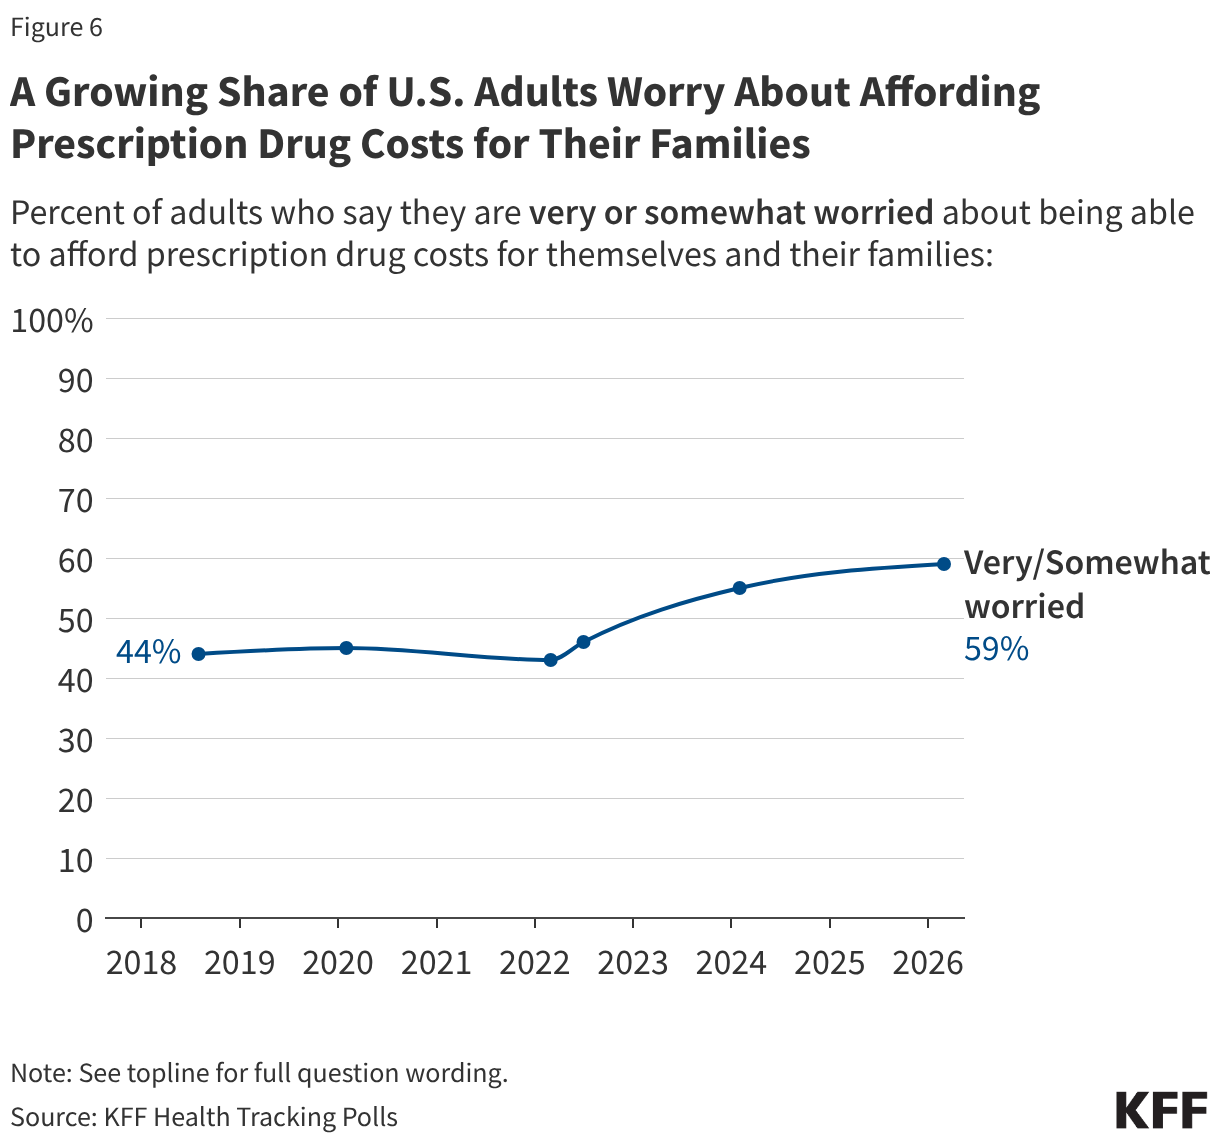
Since KFF first asked about worries affording prescription drug costs in 2018, the share of adults reporting worries has increased steadily, to a new high of six in ten (59%) in 2026.
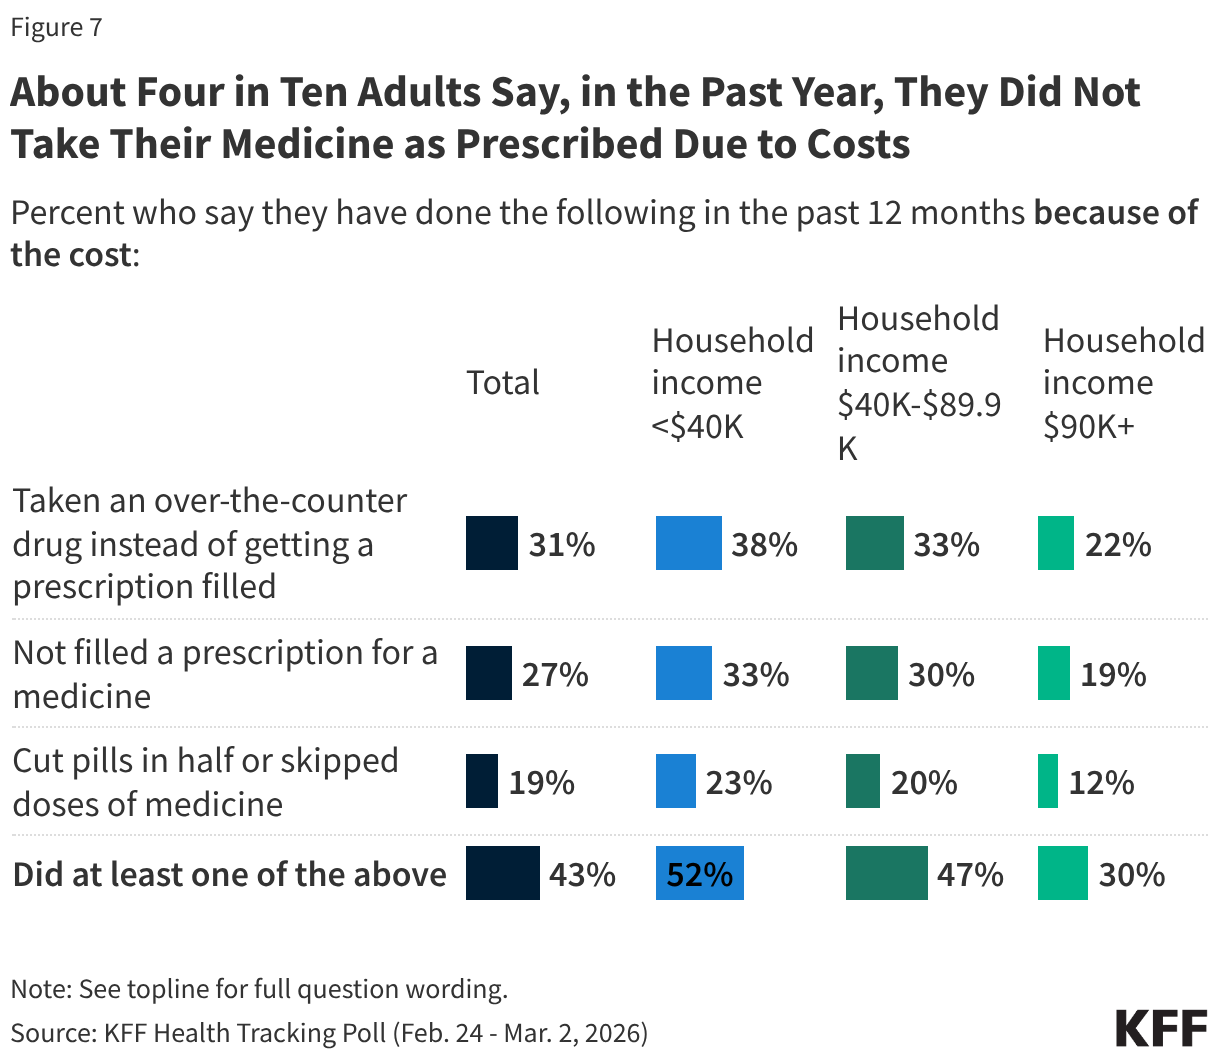
About four in ten (43%) adults report that they have not taken their medication as prescribed at some point in the past year because of the cost. This includes three in ten who have taken an over-the-counter drug instead (31%), a quarter who have not filled a prescription (27%), and about one in five (19%) who have cut pills in half or skipped doses of medicine because of the cost.
The share who reports not filling a prescription, taking an over-the-counter drug instead, or cutting pills in half or skipping doses increases to about half among adults with annual household incomes less than $40,000 (52%).
Editorial Note: This brief updates a previous analysis with more recent data, an evaluation of increases in concentration over time, and minor adjustments to the Methods.
National health spending totaled $5.3 trillion in 2024—18% of gross domestic product (GDP)—and is projected to grow faster than GDP through 2033, contributing to higher costs for families, employers, states, and the federal government. As policymakers consider a variety of strategies to make health care more affordable, they have been increasingly attentive to the effects of consolidation in health care markets and the potential implications for cost and quality of care. Hospital consolidation has been a subject of particular focus in part because spending on hospital care is the largest source of spending on health. Hospital care has also contributed more than other categories to the growth in national health spending over time, including from 2022 to 2024, when it accounted for 40% of spending growth. Consolidation may allow providers to operate more efficiently and help struggling providers keep their doors open in underserved areas, but it often reduces competition. A substantial body of evidence has found that consolidation can contribute to higher prices, with unclear effects on quality.
This analysis examines the competitiveness of markets for hospital care, based on RAND Hospital Data—a cleaned and processed version of cost reports from Medicare-certified hospitals—and American Hospital Association (AHA) survey data. The analysis examines competition among independent hospitals and health systems, referring to both as “health systems” throughout for brevity. Competition is measured in three ways: the share of metropolitan statistical areas (MSAs) controlled by a small number of health systems, the level of market concentration in MSAs based on the Herfindahl-Hirschman Index (HHI), and the share of hospitals affiliated with health systems over time. Using hospital data from 2024 (the most recent year available), this analysis focuses on general short-term or general medical and surgical hospitals depending on the dataset and excludes federal hospitals (see Methods for more details).
Key Takeaways
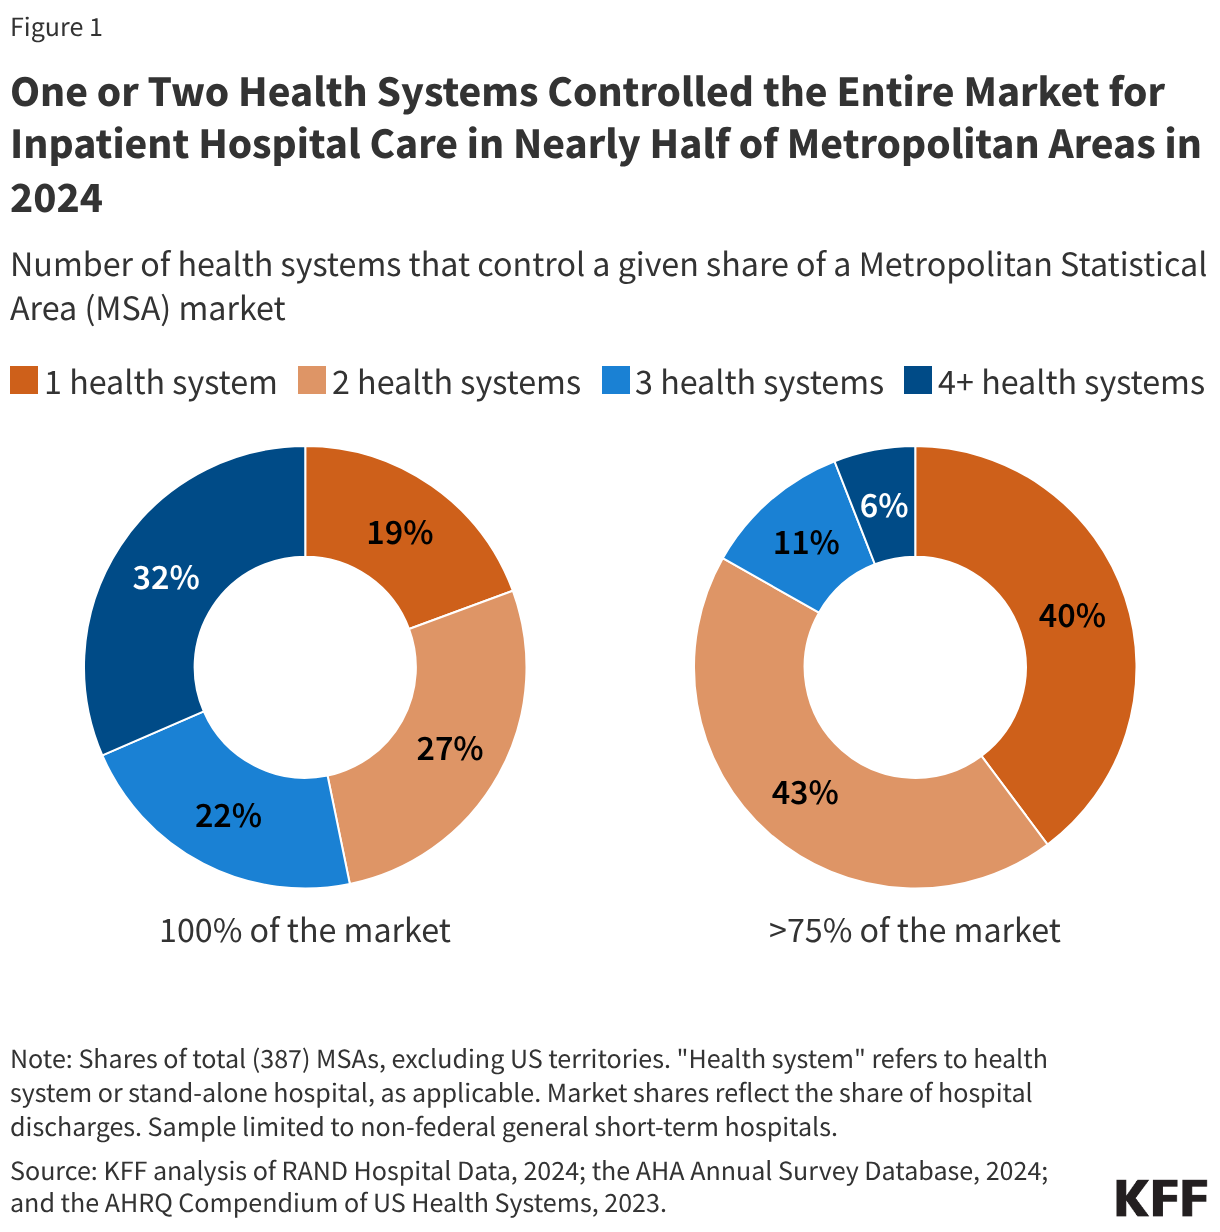
One or two health systems controlled the entire market for inpatient hospital care in nearly half (47%) of metropolitan areas in 2024.
In more than four of five metropolitan areas (83%), one or two health systems controlled more than 75 percent of the market.
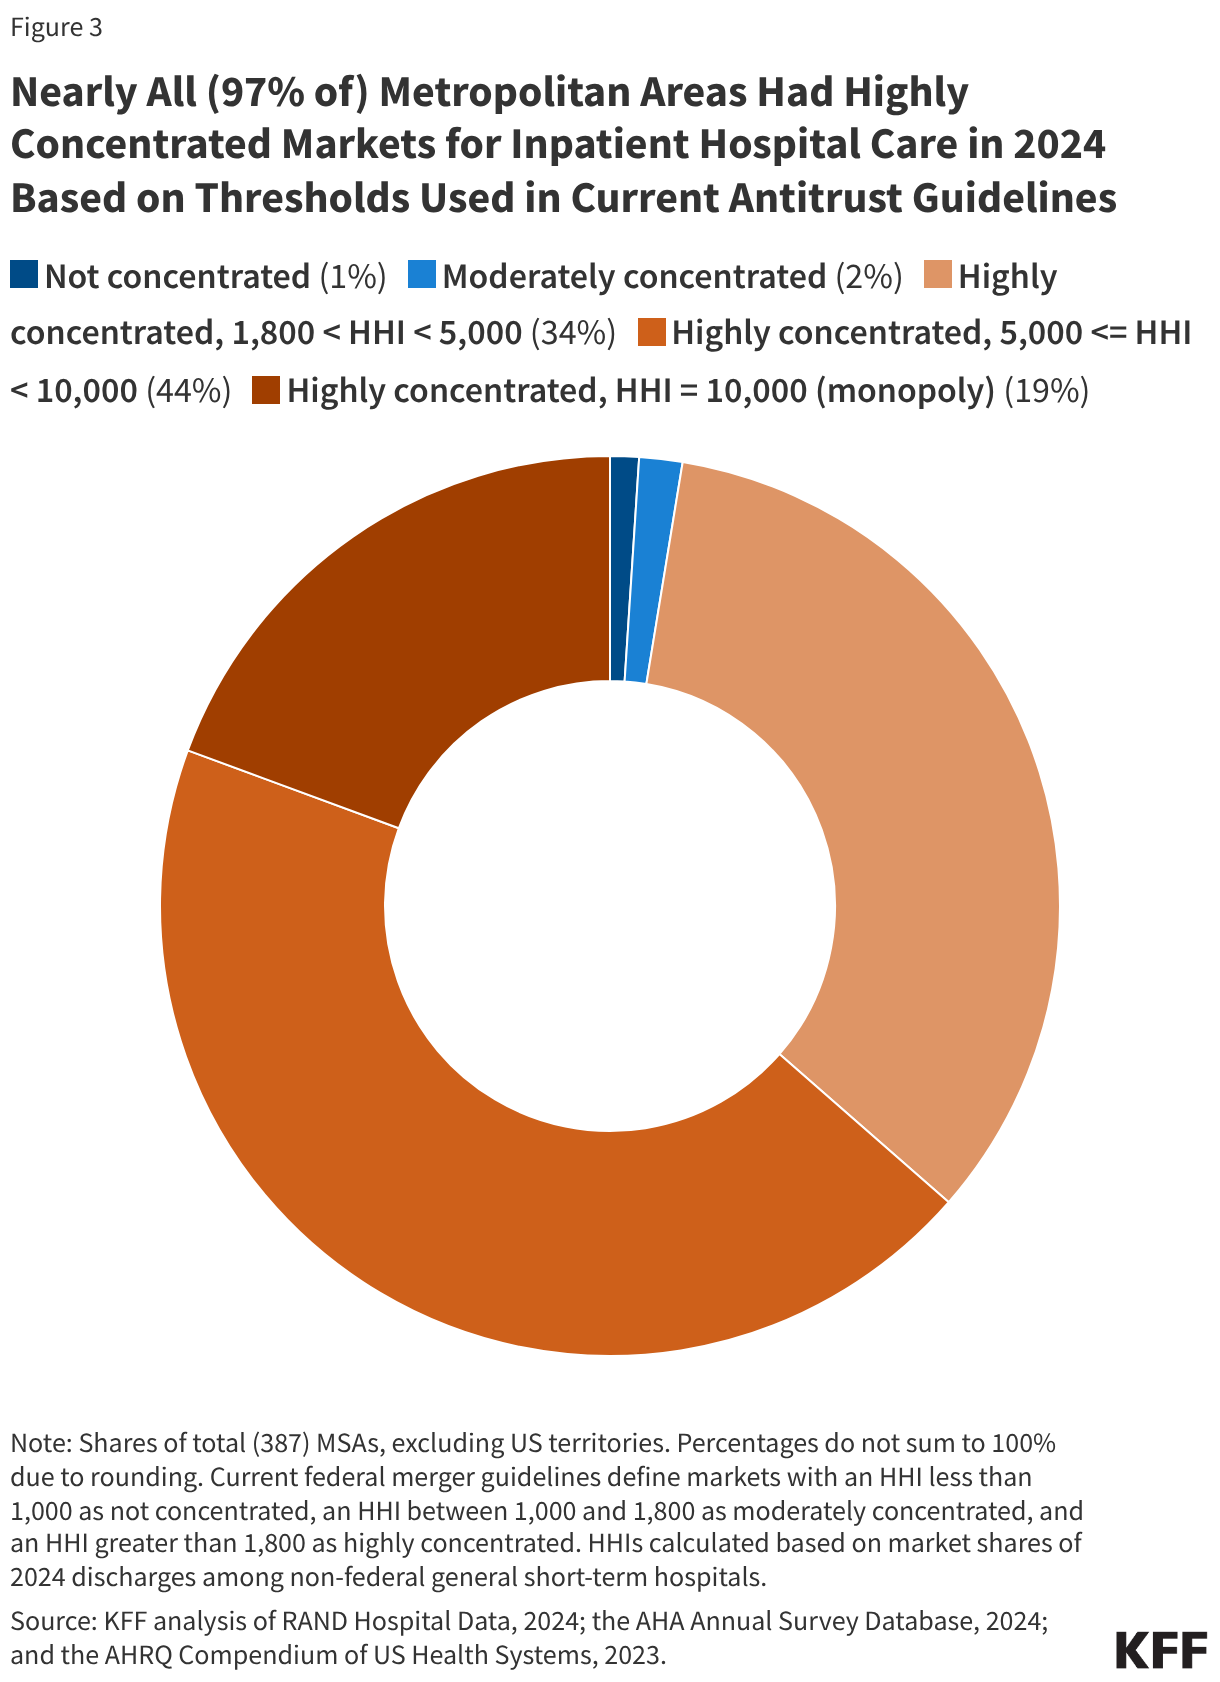
Nearly all (97% of) metropolitan areas had highly concentrated markets for inpatient hospital care when applying HHI thresholds from antitrust guidelines to MSAs.
Most hospital markets in metropolitan areas (80%) became less competitive from 2015 to 2024 or were controlled by one health system over that entire period.
One or Two Health Systems Controlled the Entire Market for Inpatient Hospital Care in Nearly Half (47%) of Metropolitan Areas in 2024
Nearly one in five (19%) metropolitan statistical areas (MSAs) were controlled by a single health system, and more than one in four (27%) markets were controlled by two systems in 2024 (see Figure 1). In more than four of five metropolitan areas (83%), one or two health systems controlled more than 75 percent of the market. These markets all met the definition of highly concentrated markets based on thresholds in current antitrust guidelines (see below). One health system controlled at least half of the market in about three out of four MSAs (76%) and at least a quarter of the market in nearly every MSA (98%).
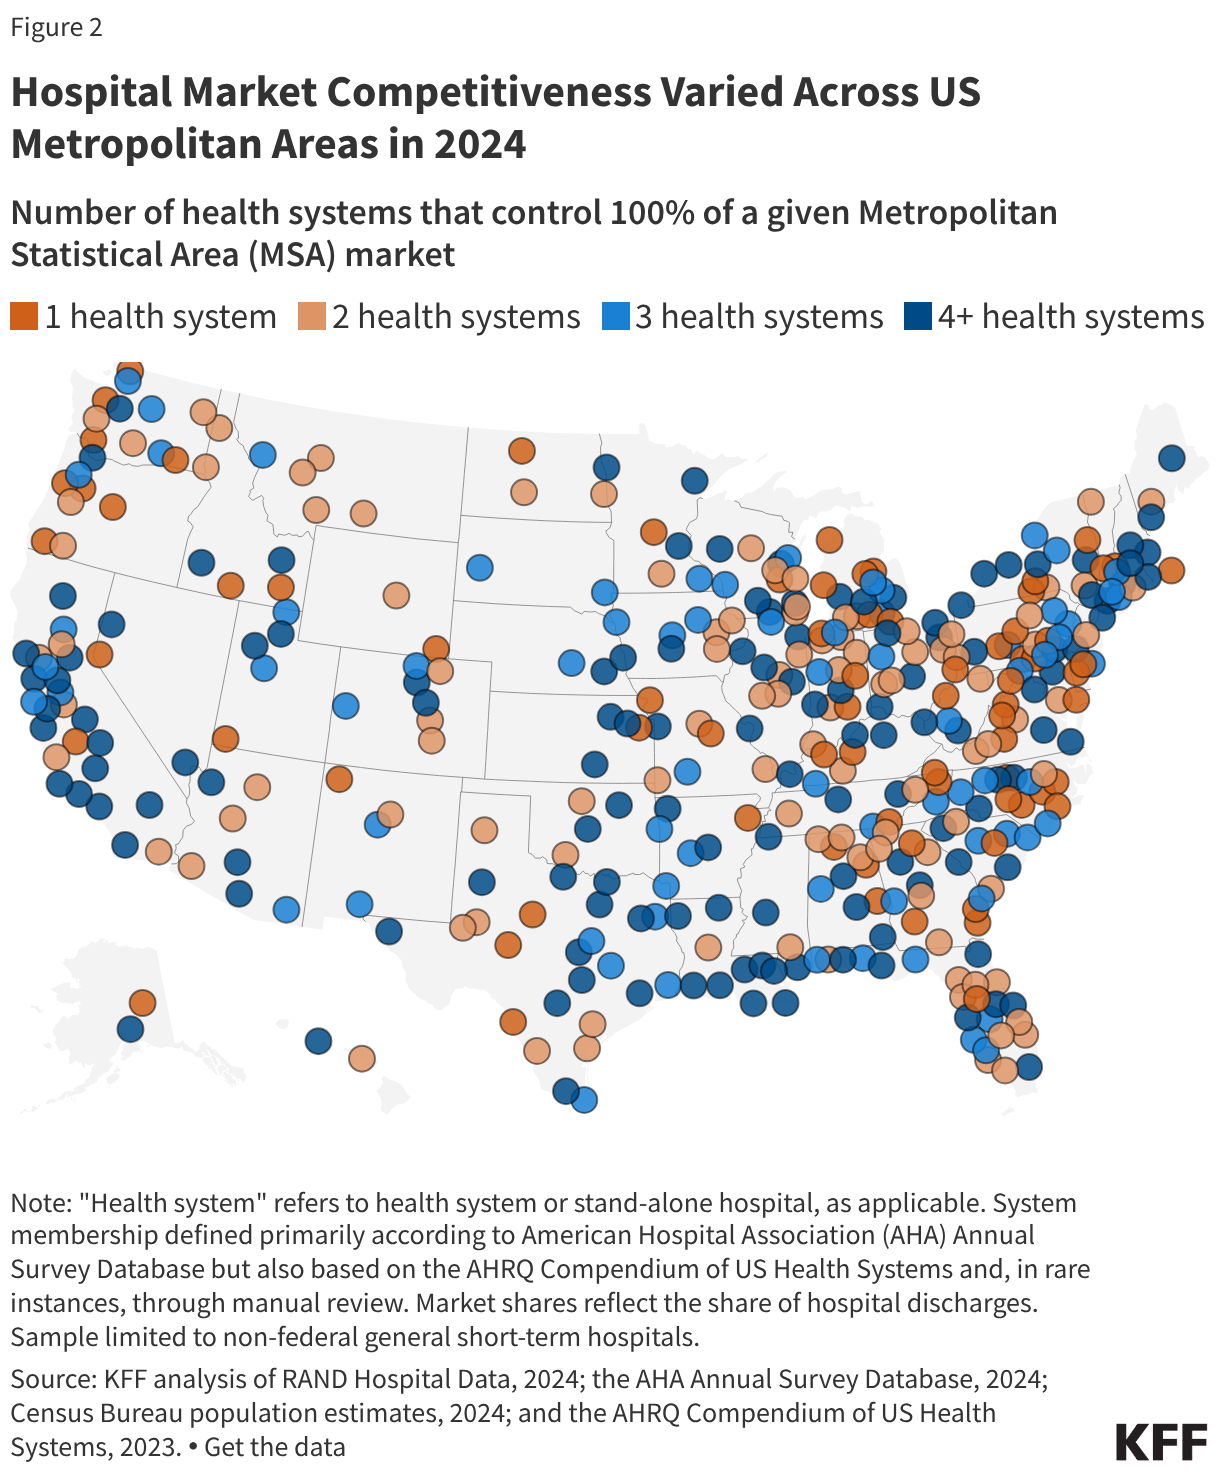
The number of health systems in a given MSA tends to increase with the population of the region. For example, in 79% of MSAs with a population of less than 200,000, one or two health systems controlled the entire market for inpatient hospital care in 2024, as in the Muncie, IN; Napa, CA; and Amherst Town-Northampton, MA MSAs (Figure 2). MSAs with one or two health systems account for nearly half (47%) of all MSAs but 12% of the U.S. population living in metropolitan areas.
Conversely, virtually all (54 of 55) MSAs with a population of at least one million people had at least four health systems, as in the MSAs encompassing Detroit, Miami, and Phoenix. MSAs with four or more health systems accounted for 35% of all MSAs but 79% of the U.S. population living in metropolitan areas.
However, in fourteen of these relatively large MSAs with four or more health systems, the two largest health systems controlled at least 75% of the market, and in 44 of these areas, they controlled at least 50% of the market. For example, in the MSA encompassing Austin, TX, with 2.6 million residents, two systems (HCA Healthcare and Ascension Healthcare) controlled 89% of the inpatient hospital care market, though Austin is home to more than four health systems. The metropolitan area encompassing Portland, OR, with 2.5 million residents and more than four health systems, is a less concentrated market than Austin’s, but the two largest systems (Legacy Health and Providence) still control a combined 62% of the market. (See Methods for discussion about MSAs as geographic hospital markets).
Nearly All (97% of) Metropolitan Areas Had Highly Concentrated Markets for Inpatient Hospital Care in 2024 Based on Thresholds Used in Current Antitrust Guidelines
Another way to assess market competitiveness is to evaluate a measure of concentration known as the Herfindahl-Hirschman Index (HHI), which is based on the number of participants in a market and their respective shares. The measure runs from 0 (perfectly competitive) to 10,000 (monopoly market). Based on current merger guidelines from the Federal Trade Commission (FTC) and Department of Justice (DOJ), markets can be grouped into three categories: not concentrated (HHI < 1,000), moderately concentrated (1,000 – 1,800), and highly concentrated (HHI > 1,800). This analysis calculates HHIs for MSAs and groups these regions accordingly, though there are other ways of defining the boundaries of hospital markets (see Methods).
Nearly all (97% of) MSAs had highly concentrated markets for inpatient hospital care in 2024 based on thresholds used in current merger guidelines (Figure 3). These guidelines reflect updates in 2023 that lowered the HHI thresholds for moderately concentrated and highly concentrated markets. Based on the thresholds used in prior guidelines, a large majority but somewhat smaller share (93%) of MSAs were highly concentrated markets for inpatient hospital care in 2024, closer to an estimate from an earlier study (90%) that used data from 2016.
As was the case when looking at counts of health systems in MSAs, larger metropolitan areas tended to be less concentrated and more competitive than less populated metropolitan areas, although this was not always the case. All 10 MSAs that were identified as either not concentrated or moderately concentrated had more than one million residents, such as the MSAs encompassing Cincinnati, Los Angeles, and Miami. However, 45 MSAs with more than one million residents—including the MSAs encompassing Houston, Denver, and Atlanta—had highly concentrated hospital markets. Overall, 72% of people living in metropolitan areas lived in highly concentrated hospital markets.
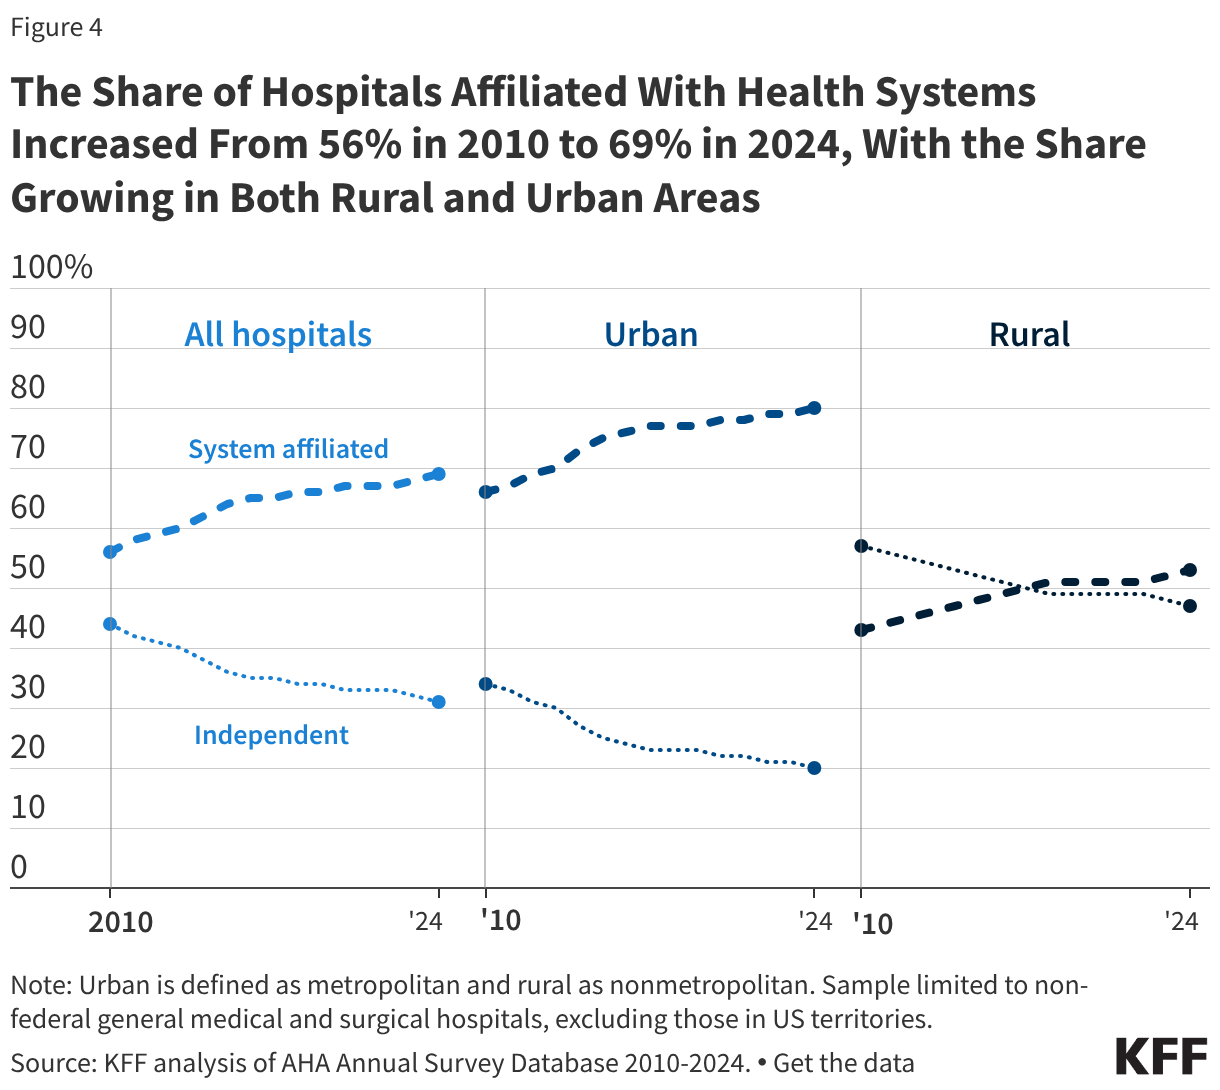
The Share of Hospitals Affiliated With Health Systems Increased From 56% in 2010 to 69% in 2024, With the Share Growing in Both Rural and Urban Areas
More than two thirds of hospitals (69%) are now part of a larger system, an increase from 56% in 2010 (Figure 4). A smaller share of rural than urban hospitals were part of a health system in 2024 (53% versus 80%), though shares have increased over time for both rural and urban regions: from 43% in 2010 to 53% in 2024 among rural hospitals and from 66% in 2010 to 80% in 2024 among urban hospitals.
Most system-affiliated hospitals in 2024 (52%) were part of a system with at least 15 hospitals, and 19% were in a system with at least 50 hospitals. Systems with at least 100 hospitals accounted for 10% of system-affiliated hospitals.
Hospitals joining larger systems may not always reduce local market competition, for example, if an independent hospital is acquired by a larger system that does not own facilities in the same market. However, mergers between hospitals that operate in different geographic markets for patient care—also known as “cross-market” mergers—may nonetheless lead to higher prices in some cases.
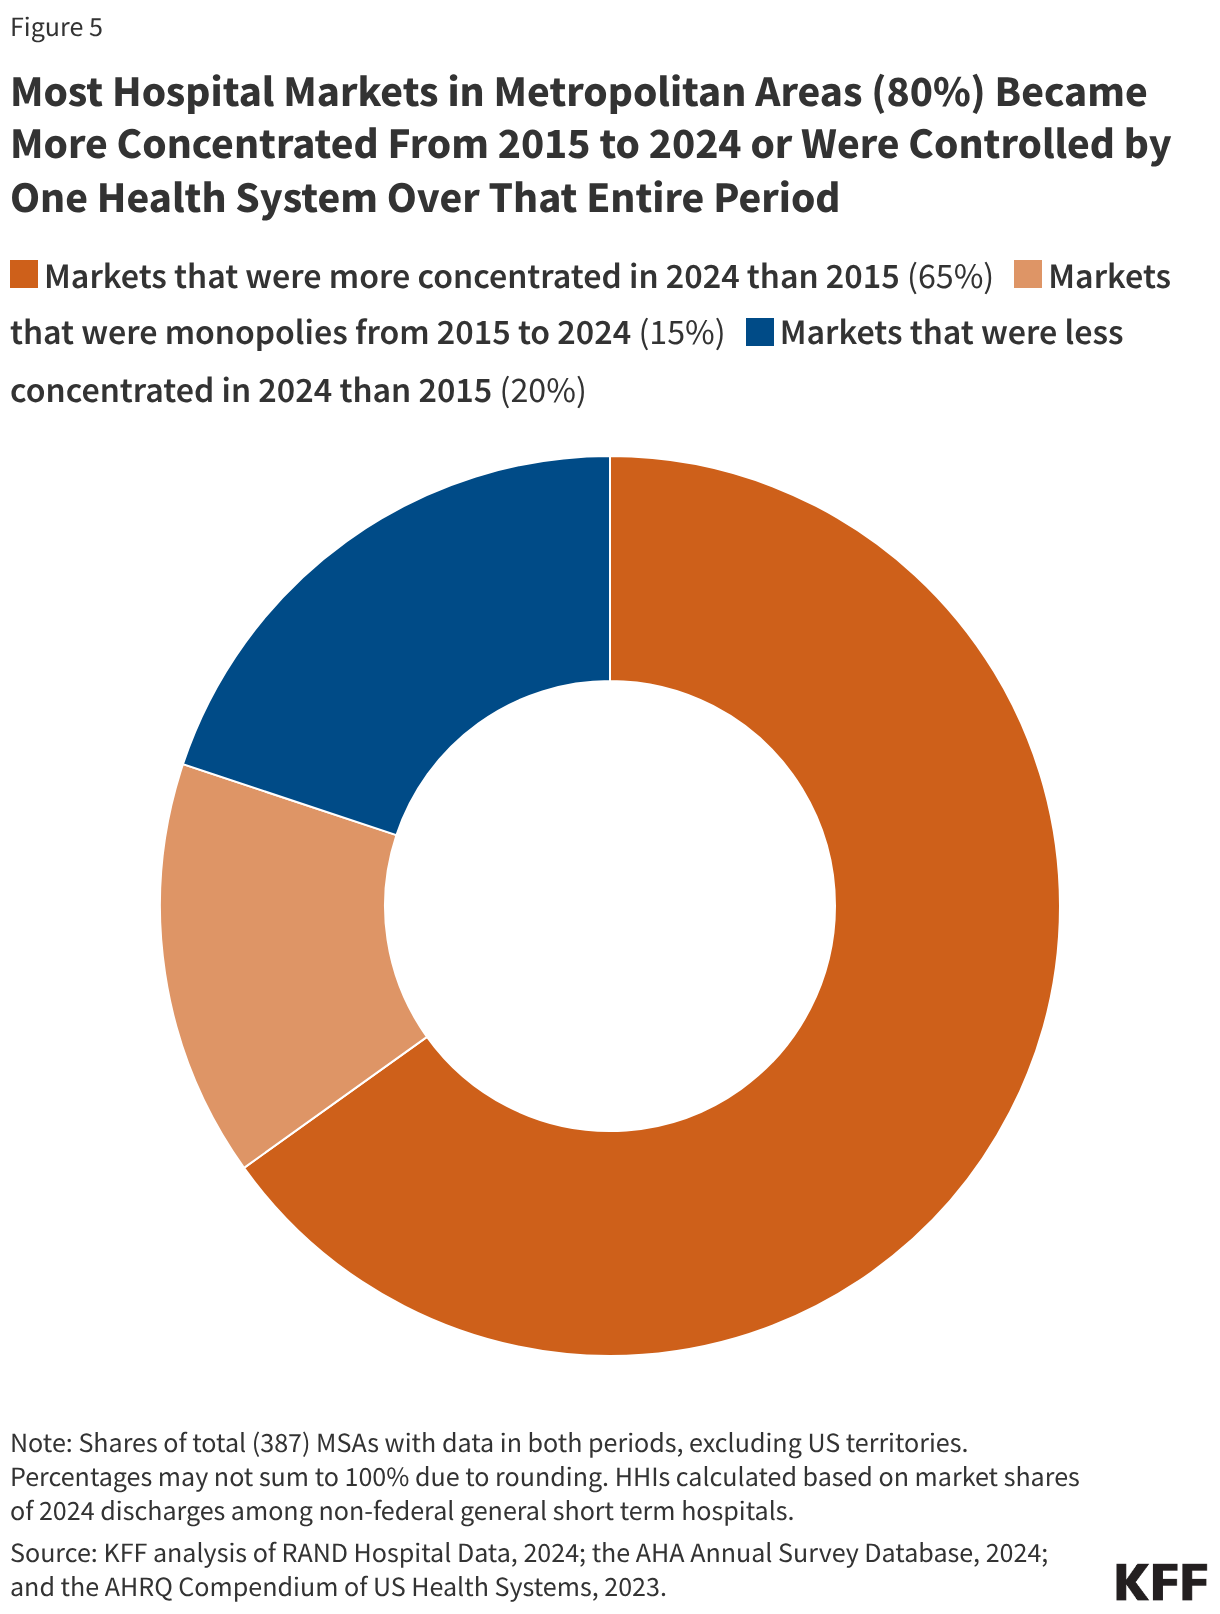
Most Hospital Markets in Metropolitan Areas (80%) Became More Concentrated From 2015 to 2024 or Were Controlled by One Health System Over That Entire Period
Four out of five metropolitan areas (80%) experienced an increase in hospital market concentration between 2015 and 2024 (Figure 5) or were controlled by a single hospital or health system for the duration. About two thirds of MSAs (65%) saw an increase in market concentration over this period, as measured by HHI, and the share of MSAs that were highly concentrated increased by two percentage points, from 95% to 97%. Fifteen percent of metropolitan areas were controlled by a single health system in both 2015 and 2024, meaning that concentration could not increase further in these markets. Concentration declined in only 20% of markets. In some cases, increases or decreases in concentration were very small.
The trend toward greater concentration was widespread across metropolitan areas of different sizes and regions. Among the 65% of MSAs that experienced increased concentration, the average HHI increased from 4,545 to 5,273, a 728 point increase. In markets that are not already controlled by one hospital or health system, market concentration may rise as a result of continued consolidation through mergers and acquisitions (Figure 4), shifts in hospital stays towards larger hospitals and health systems and away from smaller competitors, or hospital closures that reduce the number of competitors in a given market.
This work was supported in part by Arnold Ventures. KFF maintains full editorial control over all of its policy analysis, polling, and journalism activities.
Methods
Analyses of market shares and HHI (e.g., every figure except for Figure 4) were based in part on RAND Hospital Data. RAND Hospital Data are a cleaned and processed version of annual cost reports that Medicare-certified hospitals are required to submit to the federal government. Although limited to Medicare-certified hospitals, in 2024, the analysis of RAND data included the vast majority (98%) of non-federal general medical and surgical hospitals in US metropolitan areas included in the analysis of system affiliation based on the AHA Annual Survey Database (see below). Cost reports were assigned to years based on the end of the reporting period and were scaled up or down to reflect a 365-day period, as necessary. In cases where a hospital had multiple cost reports assigned to the same analysis year, the cost report covering the longer reporting period was retained. When cost reports were longer than 365 days and fully spanned a calendar year (such as one beginning 1/1/2022 and ending 7/31/2023), the cost report was assigned to both the year spanned in full (2022) and the year in which it ended (2023).
Analyses of market shares and HHI were restricted to non-federal, general short-term hospitals as identified in the RAND Hospital Data. Some general short-term hospitals in the analysis were identified as other hospital types, such as surgical hospitals, in the AHA data (6% of those that could be matched), though these represented a small share of discharges (1%). Market shares were calculated as the share of inpatient discharges in an MSA that occurred within a given health system or independent hospital. One percent of hospitals that met the other sample restrictions had missing values for inpatient discharges and were excluded. Hospitals were grouped into health systems, as applicable, based primarily on the hospital’s system affiliation in the AHA Annual Survey Database. A previous version of this analysis relied on the AHRQ Compendium of US Health Systems, but that file has not been updated to include 2024 information.
For 2024 analyses, in the small number of cases where a cost report could not be matched to the AHA Annual Survey database (2% of observations), the 2023 AHRQ Compendium was used to identify the hospital’s corresponding AHA system identifier, where available. Twelve hospitals could not be matched to AHA or AHRQ records, of which 7 were manually assigned system affiliations based on internet searches. System affiliations for 40 hospitals (2% of the sample) were updated using the 2023 AHRQ Compendium when confirmed by internet searches in cases where: (1) the Compendium identified at least two hospitals in an MSA as being part of a Compendium health system that did not correspond to an AHA system and (2) at least one of those hospitals was identified as independent in the AHA data. In 3 instances (covering 11 hospitals), two AHA systems were combined into one when indicated by the AHRQ Compendium and confirmed through internet searches.
Analyses of changes in system affiliation and market structure over time (Figures 4 and 5) relied only on AHA system identifiers. When cost reports did not match to AHA data in the Figure 5 analysis, those hospitals were treated as independent.
MSAs reflect 2023 geographic definitions from the Census Bureau delineated based on data from the 2020 decennial census. HHIs were calculated as the sum of squared market shares for all health systems in a given MSA (e.g., an MSA divided evenly between two systems would have an HHI of 502 + 502 = 5,000). MSA population estimates for 2024 were obtained from the Census Bureau.
MSAs were used as a proxy for hospital markets, which is one approach used by other studies summarizing hospital market competition across the country. There are other ways of defining markets that would yield different results when calculating the level of competition. For example, one report also evaluated MSAs but focused on where residents received their care, including at hospitals outside of a given MSA. As another example, some have defined markets based on a radius around the hospital defined by distance or estimated travel time. More precise market definitions, such as those used to define competition in antitrust cases, were not feasible. This study did not exclude MSAs with populations of at least three million as some others have done, because the analysis sought to describe competition across all metropolitan areas.
The analysis of the share of hospitals affiliated with systems was based on the AHA Annual Survey Database alone. This analysis was restricted to nonfederal, general medical and surgical hospitals. Urban hospitals were defined as those operating in a metropolitan area, while rural hospitals were defined as those operating in nonmetropolitan areas. Metropolitan and nonmetropolitan designations were identified using Urban Influence Codes (UIC) data.
Costs associated with health care and other household expenses weigh heavily on LGBT adults and health care affordability is poised to be a significant issue for all voters as we approach the 2026 midterm elections. This data note highlights the health care affordability challenges facing LGBT adults, a growing population that faces health related disparities, including related to both mental and physical health. At the same time, LGBT adults are a lower income group compared to non-LGBT adults. Findings from KFF Health Tracking Polls show that LGBT adults face more widespread concerns with affording basic necessities, including health care, compared to non-LGBT adults.
Findings
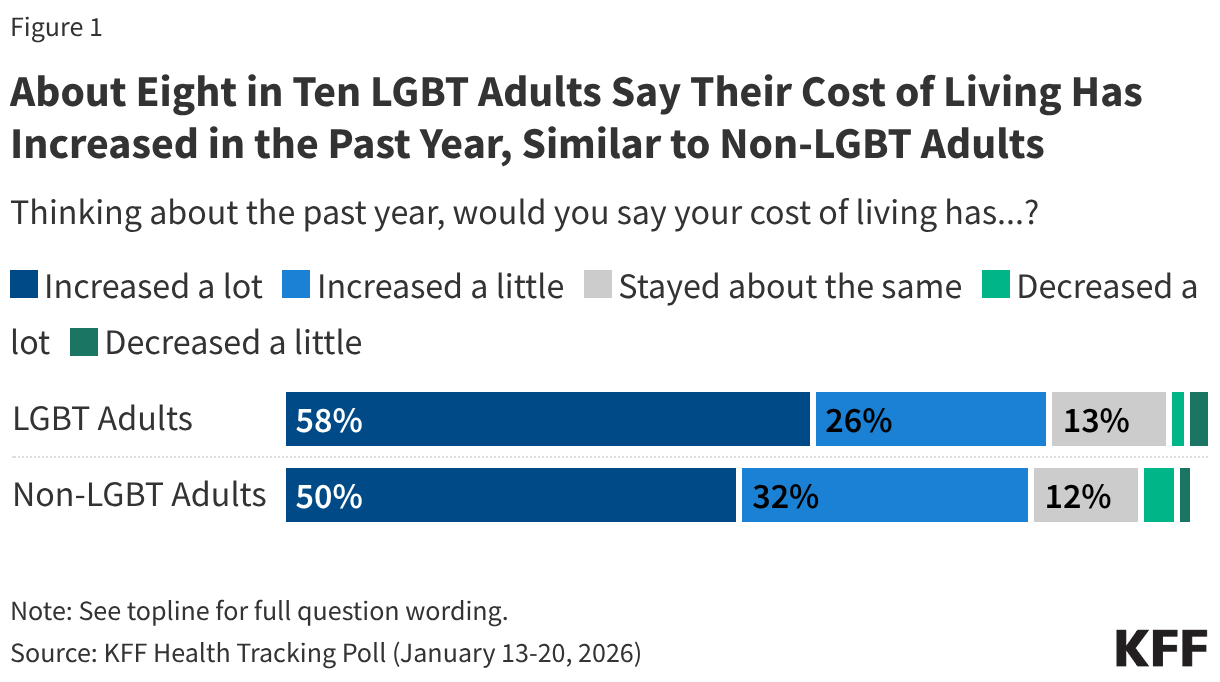
LGBT people, like the public overall, worry about the economy, with eight in ten (83%) LGBT adults saying their cost of living has increased in the past year, including more than half (58%) who say it has increased “a lot.” These are similar to the concerns among non-LGBT adults, 82% of whom say their cost of living has increased, including half who say it has increased “a lot”. Very small shares of both groups say their cost of living has “decreased” (4% of LGBT and 5% of non-LGBT adults). About one in ten LGBT and non-LGBT adults say their living expenses have remained stable over the past year (13% and 12%, respectively).
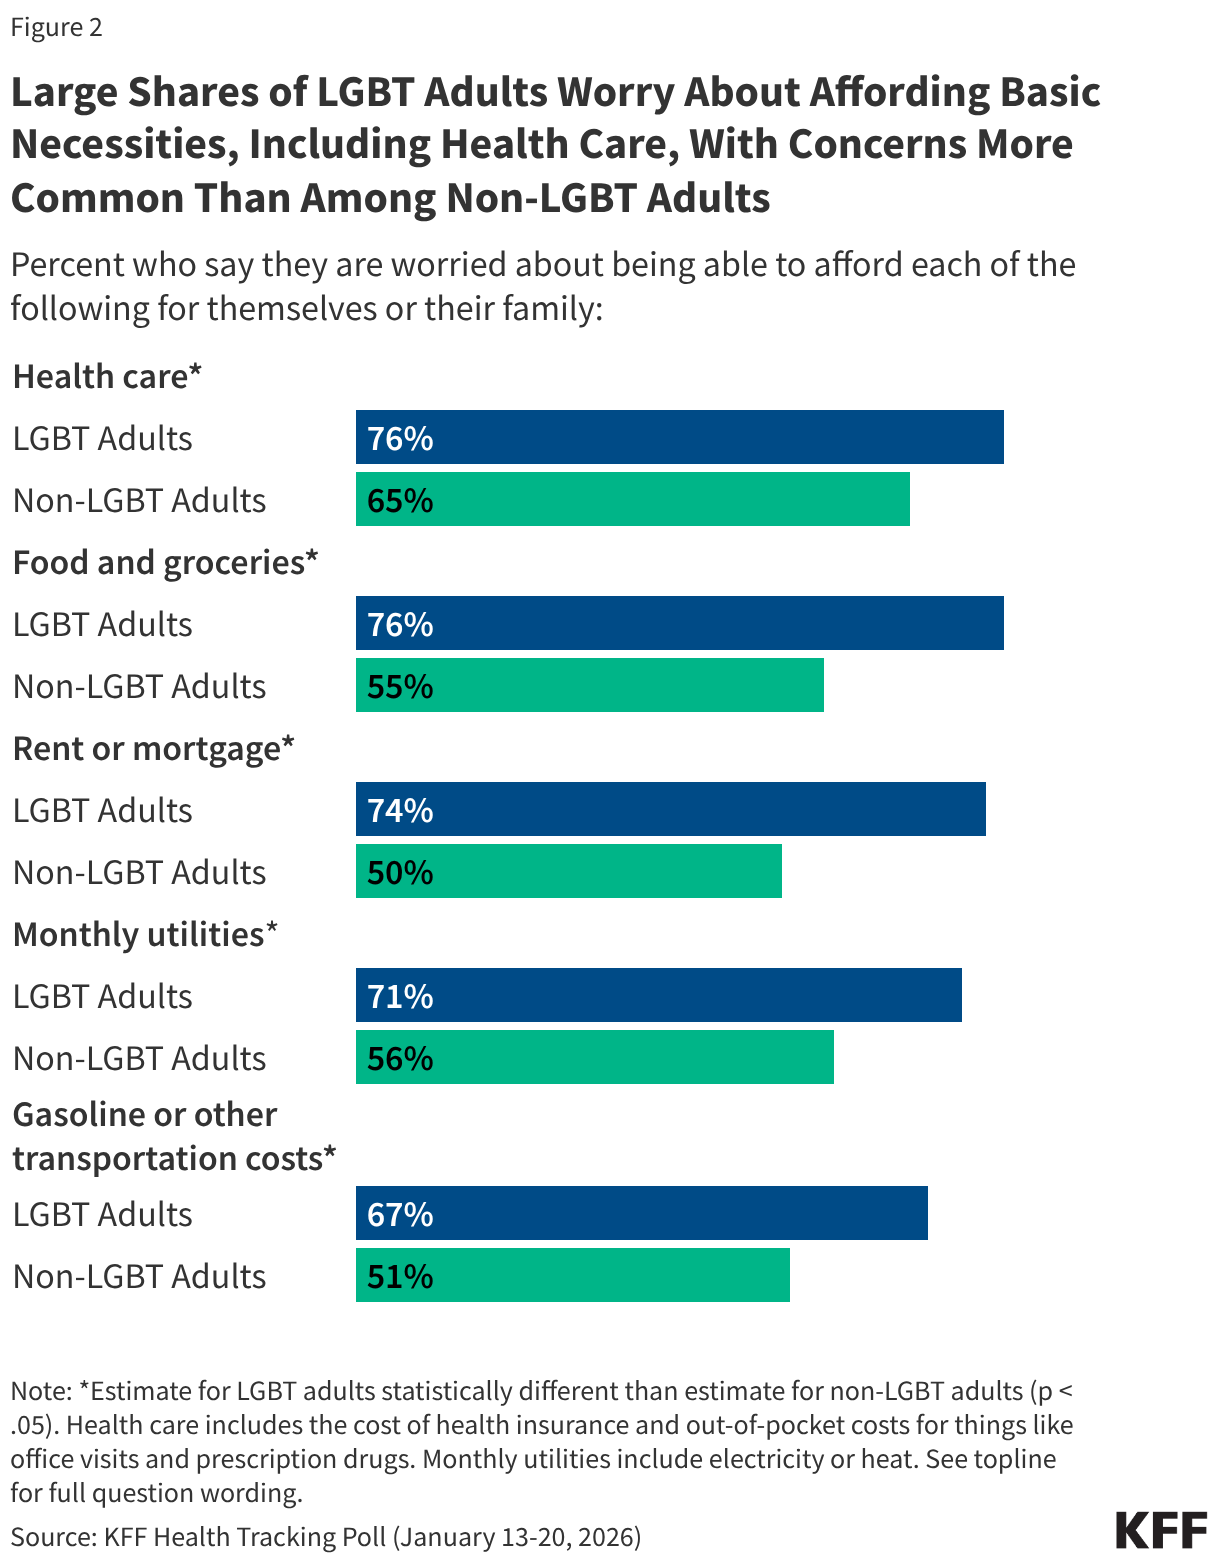
Large majorities of both LGBT adults and non-LGBT adults worry about being able to afford health care for themselves and their family, with health care topping the list of economic worries for non-LGBT adults. However, LGBT adults have broader and more pronounced concerns related to affording basic necessities across multiple categories. Three-quarters of LGBT adults (76%) say they worry about paying for health care, including the cost of health insurance and out-of-pocket costs for things like office visits and prescription drugs. This ranks similarly to their financial worries related to other household expenses like food and groceries (also 76%), rent or mortgage (74%), and monthly utilities (71%). In each case, these concerns are more widespread than those of non-LGBT adults, likely reflecting LGBT adults’ lower incomes. Cost-concerns related to gas and transportation were somewhat lower for LGBT adults (67%) compared to other household expenses but still outpaced worries among non-LGBT adults (51%). However, the survey was conducted prior to the recent rise in gas prices in the wake of the Iran war.
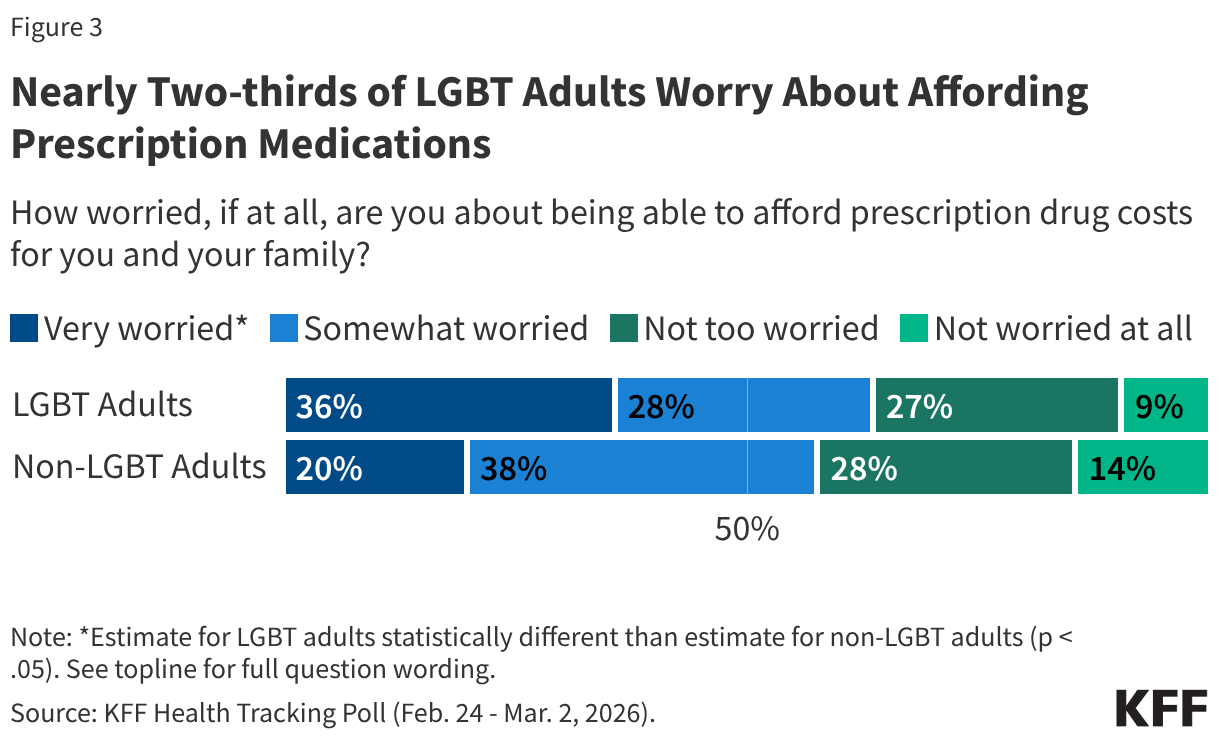
When asked specifically about prescription medication costs, nearly two-thirds of LGBT adults (64%) say that they are worried about being able to afford prescription drug costs for themselves and their family, similar to the share of non-LGBT adults (58%). However, LGBT adults are more likely to say they are “very worried” about these costs than non-LGBT adults (36% v. 20%).
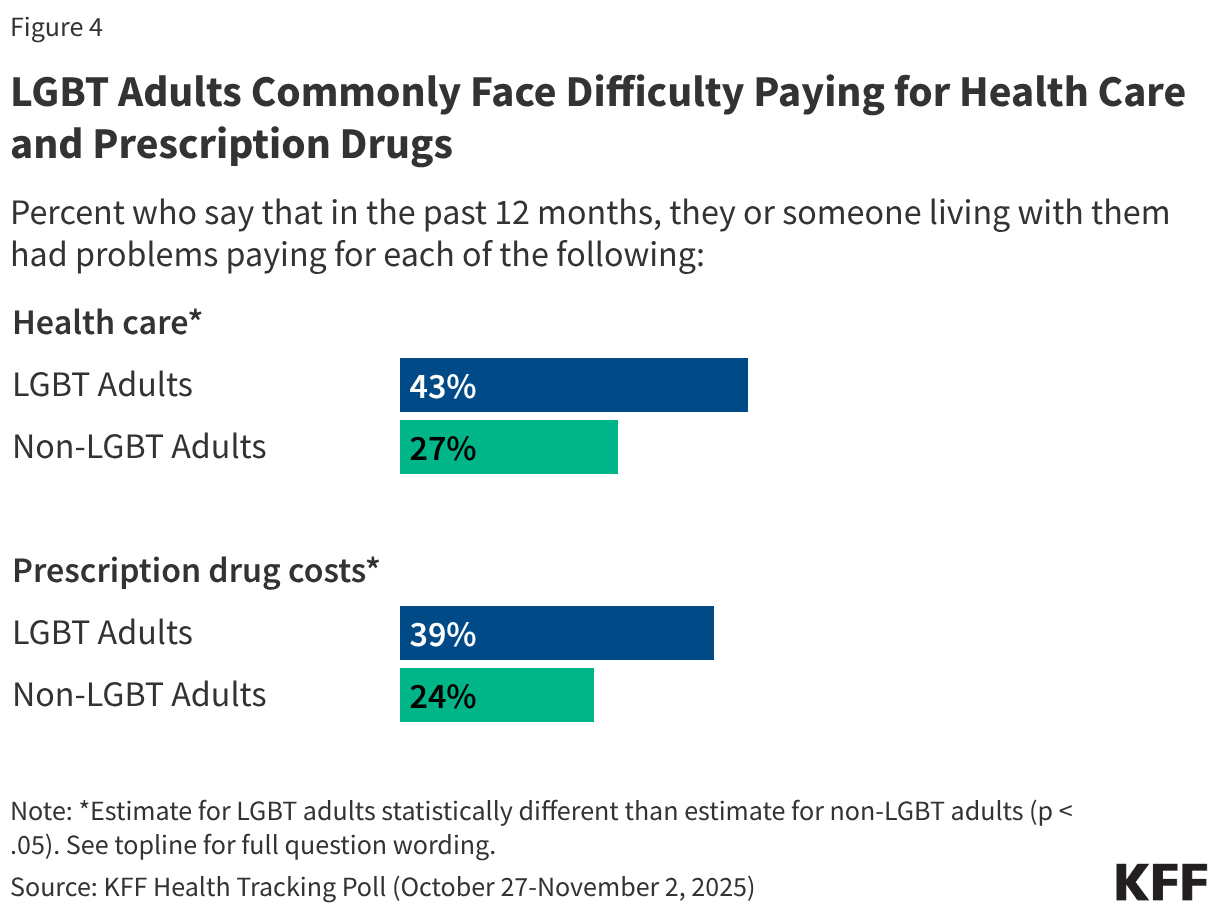
In addition to reporting worries related to health care affordability, LGBT adults commonly report facing difficulty with these expenses in their day-to-day lives. Four in ten LGBT adults (43%) report problems paying for health care, and a similar share (39%) say they had problems affording prescription drugs in the past year. In both cases LGBT adults report experiencing these difficulties at higher rates than non-LGBT adults.
GLP-1s, a class of drugs used to treat type 2 diabetes, obesity, cardiovascular disease, and other conditions, have exploded in popularity in recent years due to their demonstrated effectiveness, but are often not covered by insurance, particularly for the treatment of obesity. According to KFF polling, about half (56%) of GLP-1 users say these drugs were difficult to afford, including one in four who say they were “very difficult” to afford. The Trump administration is pursuing various approaches to lowering the cost and expanding coverage of these medications. These approaches include striking “most-favored nation” deals with GLP-1 manufacturers Novo Nordisk and Eli Lilly, providing access to discounted prices for GLP-1s through TrumpRx, and implementing a new demonstration program called the BALANCE (Better Approaches to Lifestyle and Nutrition for Comprehensive hEalth) Model to expand Medicare and Medicaid coverage of GLPs for obesity, which is currently subject to statutory limitations (prohibited in Medicare, permissible but not required in Medicaid). In addition, the GLP-1 drug semaglutide (branded as Ozempic, Wegovy, and Rybelsus) was selected for Medicare drug price negotiation in 2025, with a negotiated price set to take effect in 2027.
This brief describes current coverage of GLP-1s in Medicare and Medicaid, the Centers for Medicare & Medicaid Services’ (CMS) efforts to expand access and lower costs for GLP-1s through temporary demonstration programs including the BALANCE Model, and potential impacts on beneficiaries and program budgets.
Current law prohibits Medicare from covering obesity drugs and gives states flexibility to cover weight loss drugs under Medicaid
Limitations on coverage for obesity drugs in Medicare and Medicaid mean that millions of people who have obesity and might benefit from taking GLP-1s may be unable to access them unless they are able to pay the full cash price out of their own pockets, which would likely be prohibitive for people with Medicaid who must have low incomes to qualify for the program, as well as for many people on Medicare with low and modest incomes. Under the Medicare Part D outpatient prescription drug benefit program, Part D plans are required to cover a minimum of two drugs in each therapeutic category and class, but from the outset, Medicare has been prohibited by law from covering medications when used specifically for weight loss. People on Medicare can get GLP-1s covered by Part D plans only if they are used for a medically accepted FDA-approved indication other than obesity, like type 2 diabetes, cardiovascular disease risk reduction, or sleep apnea.
Under the Medicaid Drug Rebate Program (MDRP), state Medicaid programs must cover nearly all of a participating manufacturer’s FDA-approved drugs for medically accepted indications. However, federal law gives states the option whether to cover drugs used for weight loss. As a result, GLP-1 coverage for medically accepted FDA-approved indications other than obesity is required while access to GLP-1s to treat obesity under Medicaid is currently limited. Only 13 states provided coverage as of January 2026, down from 16 states in 2025, likely reflecting the significant costs of coverage and recent state budget challenges and federal funding cuts.
CMS is proposing temporary expansions of Medicare and Medicaid coverage of GLP-1s for obesity through demonstration programs
CMS has proposed a two-step approach to expanding coverage of GLP-1s for obesity in Medicare – a temporary payment demonstration for 2026, known as the Medicare GLP-1 Bridge, and a new Center for Medicare and Medicaid Innovation (CMMI) model, known as the BALANCE Model, beginning January 2027. For Medicaid, GLP-1 coverage will be expanded through the BALANCE Model beginning in May 2026. The BALANCE Model ends for both state Medicaid agencies and Medicare Part D plans in December 2031. (See Figure 2 for a timeline of key activities associated with the GLP-1 coverage demonstrations.)
Medicare coverage of GLP-1s for obesity begins in July 2026 through the Medicare GLP-1 Bridge, prior to implementation of the BALANCE Model
Until implementation of the BALANCE Model for Part D plans begins in January 2027, CMS will provide Part D beneficiaries with coverage of select GLP-1s for obesity from July 1, 2026 to December 31, 2026 through the Medicare GLP-1 Bridge, which is a separate short-term demonstration established using Section 402 demonstration authority. The Medicare GLP-1 Bridge is a nationwide demonstration program that will be separate from Part D coverage, meaning Part D sponsors will not have to opt into the demonstration for eligible beneficiaries to gain access, nor will Part D sponsors bear any financial risk for costs incurred by their enrollees associated with the demonstration.
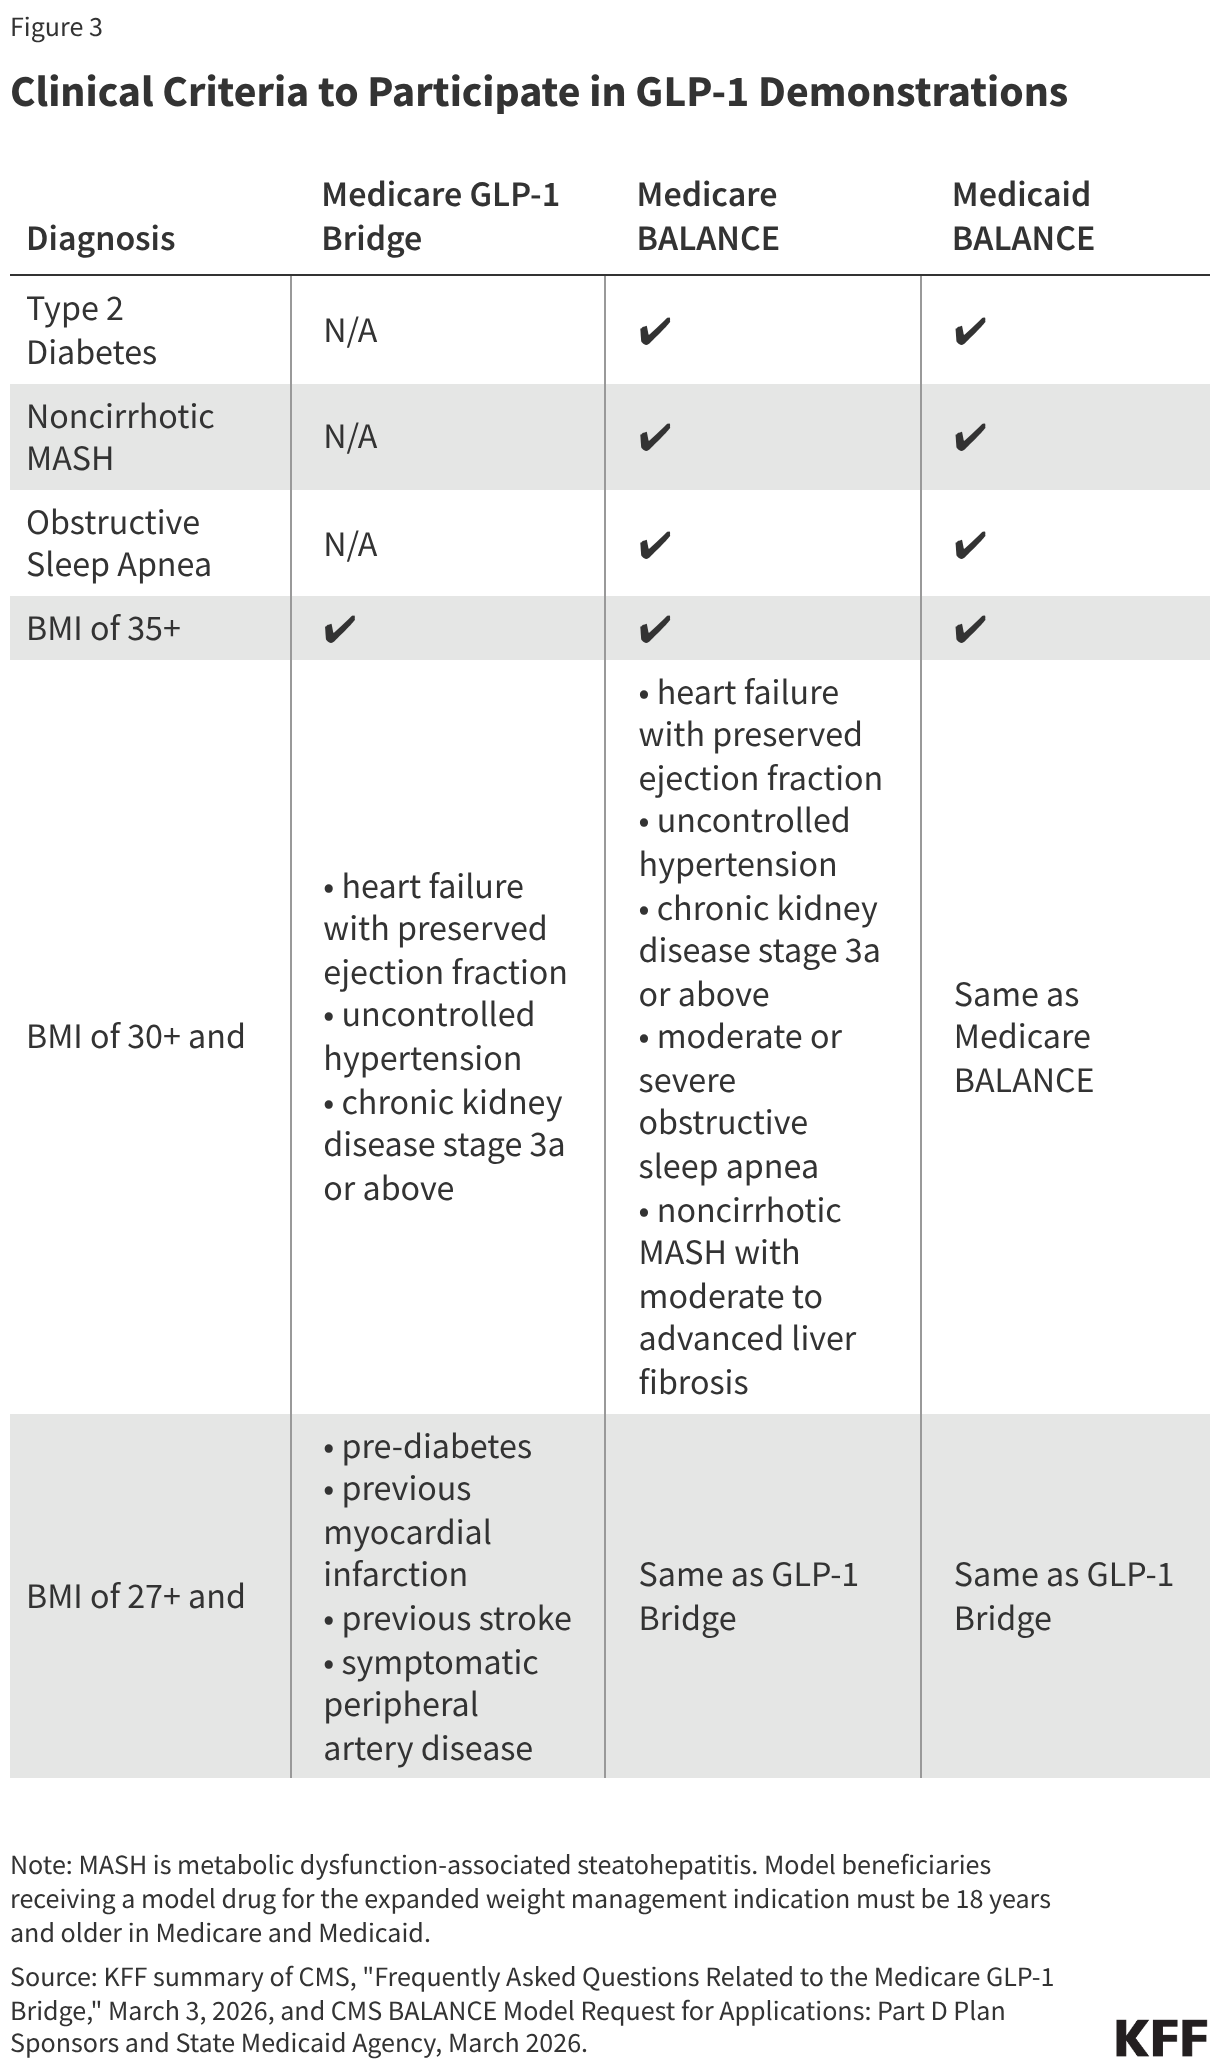
According to FAQs released by CMS in March 2026, Medicare beneficiaries enrolled in Part D plans who meet the eligibility criteria will have access to GLP-1 medications approved for weight reduction (Wegovy and Zepbound) at a copayment of $50 per month. For a beneficiary to qualify, their provider must submit a prior authorization request that attests the beneficiary is being prescribed the drug to reduce excess body weight and ongoing maintenance of weight reduction and that they fall into one of three categories related to BMI and other clinical diagnostic criteria (Figure 3).
Manufacturers have agreed to provide Wegovy and Zepbound at a net price of $245 per month supply. When participating beneficiaries fill a prescription for one of these drugs, pharmacies will collect the $50 copayment and submit claims to a central processor for reimbursement. Pharmacies will be reimbursed by CMS at no lower than the wholesale acquisition cost (WAC) of a drug, less the beneficiary copay, plus a dispensing fee and, as applicable, sales tax. Manufacturers will then owe money back to CMS for the difference between the WAC and the negotiated $245 net price.
Because this payment demonstration operates outside coverage under a Part D plan, the $50 copayment toward these medications will not count toward a participating beneficiary’s Part D deductible or the $2,100 out-of-pocket maximum, and copayments will stay consistent at $50 per month, regardless of the Part D benefit phase a beneficiary is in when they fill the prescription. Medicare beneficiaries who are already receiving coverage from their Part D plan for a GLP-1 for a Medicare-covered use, such as type 2 diabetes, cardiovascular disease risk reduction, or sleep apnea, will continue to access the drug through their Part D plan and not through the Medicare GLP-1 Bridge, which will only provide coverage of GLP-1s when used for obesity.
For beneficiaries enrolled in the Low-Income Subsidy (LIS) program, the LIS cost-sharing subsidies will not apply in the Medicare GLP-1 Bridge. This may make it more difficult for low- and modest-income beneficiaries who are otherwise eligible to participate to take advantage of coverage under the short-term demonstration in 2026 if the $50 monthly copayment is unaffordable.
For participating beneficiaries to maintain Medicare coverage of their GLP-1 medication for obesity after the Medicare GLP-1 Bridge ends at the end of 2026, they will need to be enrolled in a Part D plan that chooses to participate in the BALANCE Model in 2027. This could mean having to switch Part D plans for the coming year, with potential cost and coverage implications for other medications beneficiaries use.
The BALANCE Model expands coverage of GLP-1s for obesity in Medicaid beginning in 2026 and under Medicare beginning in 2027
According to CMS, the BALANCE Model aims to increase access to GLP-1 medications and healthy lifestyle interventions to help people on Medicare and Medicaid improve their overall health. Under this model, CMS will negotiate with manufacturers of GLP-1s to provide lower prices to the state Medicaid programs and Medicare Part D plans that choose to participate in the model. For beneficiaries to be eligible under the BALANCE Model in either Medicaid or Medicare Part D (including Part D LIS enrollees), providers must attest that they meet certain clinical criteria, including qualifying for a GLP-1 for a currently covered use (such as type 2 diabetes or sleep apnea) or for use to treat obesity based on similar clinical criteria as applied in the Medicare GLP-1 Bridge (Figure 3).
In addition to offering lower prices for GLP-1s, this model will provide patients with access to lifestyle support programs at no cost, which are intended to support medication adherence as well as increase GLP-1 effectiveness. (Details about these programs are not yet available.) These lifestyle support programs will be provided by participating manufacturers. As part of their agreements with CMS, the manufacturers must demonstrate how these lifestyle support programs will meet the program requirements, including encouraging healthy eating and increasing physical activity, supporting medication adherence, ensuring engagement with the program on a regular basis, and ensuring availability of this program to all patients receiving these medications, either online or offline for those who have limited digital access. However, prescribing providers will not be required to document that patients are actively participating in these lifestyle support programs as part of attesting to their eligibility for the model based on other clinical criteria.
Participation in the BALANCE Model is voluntary for drug manufacturers, state Medicaid programs, and Medicare Part D plans
Participation in BALANCE is voluntary for drug manufacturers, state Medicaid agencies, and Medicare Part D plans. The date for manufacturers to notify CMS of their interest in participating was January 8, 2026; for Medicare Part D plans is April 20, 2026; and for state Medicaid programs is July 31, 2026 (Figure 2).
Drug Manufacturers
During the model pre-implementation period in early 2026, CMS negotiated with Novo Nordisk and Eli Lilly to come to agreement on the key parameters of the model, including details about pricing of the model drugs, cost sharing, rebate calculations, access policies (i.e., coverage criteria and prior authorization policies), the length of the agreement, data sharing arrangements, and agreement on lifestyle supports that will be offered. Both manufacturers have agreed to participate in the model, and the following medications will be included: all formulations of Mounjaro, Ozempic, Rybelsus, and Wegovy, the KwikPen formulation of Zepbound, and, if approved by the FDA, the tablet formulation of Orforglipron. The manufacturers have agreed to a $245 net price per 30-day supply for all model drugs in 2027 for the Medicare program though the net price for state Medicaid programs is confidential to the public. CMS and manufacturers may renegotiate terms in the future depending on certain circumstances such as changes in the FDA labeling, new clinical evidence, or new products launched.
State Medicaid Programs
Participation. For state Medicaid agencies that opt to participate in the model, implementation will be on a rolling basis from May 1, 2026 through January 1, 2027. To participate in the model, state Medicaid programs must sign a State Agreement with CMS and then adopt supplemental rebate agreements (SRAs) with each participating manufacturer that reflects the standard key terms that the participating manufacturers and CMS have agreed to. While states typically develop their own utilization management strategies, the model key terms establish standardized coverage criteria (Figure 3). States may offer broader coverage but cannot make coverage criteria more restrictive, and the Medicaid key terms must apply equally in both fee-for-service and Medicaid managed care. Although the Medicaid component of the BALANCE Model will launch May 1, the deadline for the state Medicaid agency Request for Applications (RFA) is July 31, 2026.
Cost. The discounted GLP-1 net price for state Medicaid programs will be available through additional supplemental rebates (on top of statutory rebates through the MDRP). To participate in the model, state Medicaid programs must terminate or update any existing SRAs with participating manufacturers. While the original announcement of the MFN deals with Eli Lilly and Novo Nordisk noted Medicaid programs would also have access to the $245 price available to Medicare, the final negotiated discounted price available to state Medicaid programs mentioned in the state Medicaid RFA is not available to the public, only participating states. The model will not affect out-of-pocket costs for Medicaid enrollees, which are limited to nominal amounts under federal law.
Medicare Part D Plans
Participation. Part D plan sponsors must apply to participate in the model by April 20, 2026, and after CMS confirms eligibility, plan sponsors will indicate whether they will participate in the model by June 1, 2026. Participants can include sponsors of Part D stand-alone prescription drug plans (PDPs) and Medicare Advantage prescription drug plans (MA-PDs), including Special Needs Plans (SNPs), and employer plans that offer Part D. Eligible plan types exclude Defined Standard benefit plans, which charge a standard 25% coinsurance amount for all covered drugs and do not vary cost sharing by drug type or formulary tier, although plan sponsors can indicate if they wish to convert a Defined Standard benefit plan to another basic benefit type in order to become eligible. Participation is at the plan sponsor level, and plan sponsors can choose which of their specific plan benefit packages will be part of the model. However, CMS will require plan sponsor participants to include all of their enhanced alternative plans and 90% of their enrollment in basic plans.
Cost sharing. Part D plans must adopt specific cost-sharing limits under the basic benefit plan structure as agreed upon by CMS and manufacturers. Cost sharing for model drugs will be limited to $245 for a 30-day supply in the deductible phase and a lower amount in the initial coverage phase: $50 per month for enhanced plans and employer group plans and $125 per month for basic plans (though plan sponsors can choose to apply lower cost-sharing amounts to model drugs as long as they do so uniformly across all model drugs). Once beneficiaries reach their out-of-pocket maximum (set at $2,400 in 2027), they will pay $0 for their medications, including for model drugs. Part D plans participating in the model are required to place all model drugs on the same formulary tier, cover all medically accepted indications for model drugs, and apply the same cost sharing to all indications.
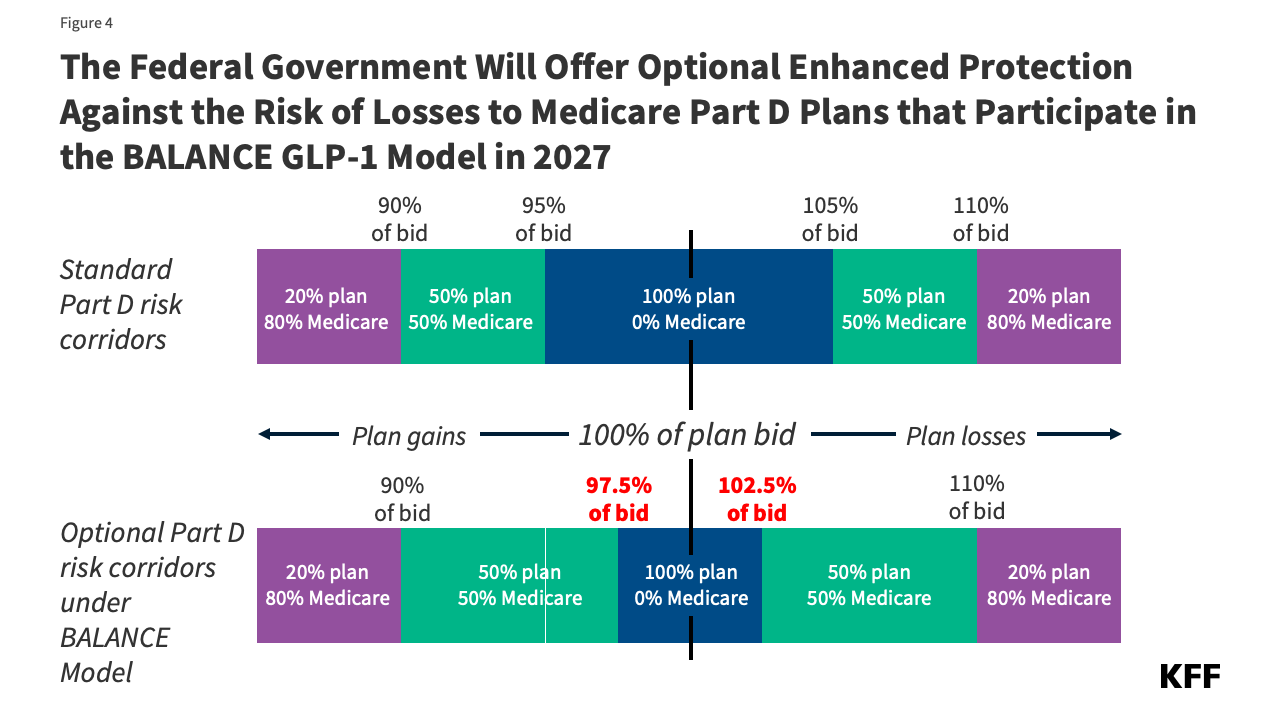
Participation incentives. Because the model is voluntary for Part D plan sponsors, CMS has designed financial incentives to encourage plan participation. The primary approach to be taken in 2027 involves an optional narrowing of the risk corridor thresholds to reduce the range of spending where PDPs bear full risk for actual costs higher than their bids (Figure 4). Model participants will qualify for this additional financial protection if they opt in and have higher-than-average utilization of model drugs relative to other similar plan participants. In future model years, CMS is considering additional payment incentives, including higher direct subsidy payments based on an adjustment factor to the beneficiary risk score in participating plan bids.
CMS is aiming for a “critical mass” of Part D sponsors to participate and has established a threshold participation rate of 80% for 2027. This participation rate will be calculated as the number of beneficiaries enrolled in Part D plans applying to participate in the model divided by the total number of beneficiaries in all Part D plans (excluding enrollment in special needs plans and employer plans from these calculations, even though they are eligible to participate in the model, but including enrollment in Defined Standard benefit plans, even though they are ineligible to participate). (This calculation method could produce a different participation rate than it would be if the calculation was based on enrollment in all eligible plans that apply to participate divided by enrollment in all eligible plan types overall. CMS has not explained the rationale for their chosen method.) If the 80% threshold is not met, CMS will not move forward with the BALANCE Model in Medicare in 2027. CMS will notify Part D plan sponsor applicants whether this threshold is met by April 30, 2026. If the participation threshold isn’t met for BALANCE, which will be known by the end of April, CMS has not indicated if or how it would affect the implementation of the GLP-1 Bridge.
Millions of people with Medicare and Medicaid could benefit from expanded coverage of GLP-1s for obesity
Overall, the BALANCE Model could greatly expand access to GLP-1s depending on the level of participation by drug manufacturers, state Medicaid agencies and Part D plans. In addition to providing coverage of these drugs for obesity, which would be a new indication in Medicare and in most states under Medicaid, this model would also allow beneficiaries in participating states and Part D plans to access GLP-1s for obesity at a lower out-of-pocket cost than if they were to purchase them with cash at the direct-to-consumer prices offered bythe manufacturers. For Medicare Part D enrollees who already have coverage of a GLP-1 due to a currently covered indication, they might face lower out-of-pocket costs if their current cost-sharing amounts are higher than the cost-sharing limits that have been established for the BALANCE Model ($50 for enhanced plans, $125 for basic plans). Additionally, this model will provide access to a lifestyle support program to promote healthy behaviors and increase the effectiveness of GLP-1s, which could provide improvements in health along with sustained weight reduction.
However, there are factors that could limit the reach of this model for both the Medicaid and Medicare populations. For example, if the level of participation by state Medicaid agencies is relatively low, the impact of this model for Medicaid recipients may not be very far reaching. In addition, state Medicaid agencies can choose to participate in the model initially but then decide to drop out of the model in later years, which could result in disruptions in coverage.
Within Medicare, if participation by Part D plan sponsors is less than the 80% threshold, CMS has stated that it will not launch the model in Medicare in 2027. This sets up the possibility that Medicare beneficiaries could have coverage of GLP-1s for obesity under the Medicare GLP-1 Bridge in the latter half of 2026 but then lose access in 2027 if the BALANCE model is not implemented. Similarly, beneficiaries will need to be enrolled in a participating plan in order to maintain coverage of GLP-1s for obesity in 2027, which could mean switching plans and disrupting current coverage.
Assuming the BALANCE Model launches in 2027 with at least 80% participation, Part D plans could drop out of the model in future years, which could interrupt treatment, or require frequent plan changes for Medicare Part D enrollees to maintain access. It is unclear from CMS documentation whether they will reassess the 80% participation threshold in each model year for the model to continue. It is also unclear whether Part D plan sponsors will be able continue to cover GLP-1 drugs for the treatment of obesity once the model ends if Medicare’s statutory exclusion on weight loss drugs is not lifted.
Another uncertainty for Part D enrollees in terms of their out-of-pocket costs is the impact of the model on Part D premiums. Participating plan sponsors will factor the cost of the model into their bids for contract year 2027, and assuming the participation threshold is met, plans may incur higher costs, which would be incorporated into the bids of plans that most beneficiaries are currently enrolled in. That could have the effect of increasing Part D premiums across the board, although Medicare Advantage plans can use rebates to buy down Part D premiums, but this is not an option for stand-alone PDPs. It is possible that CMS could modify the parameters of the Part D PDP premium stabilization demonstration to provide greater premium subsidies for PDP plan sponsors that participate in the BALANCE Model. The ultimate effect on Part D plan bids and premiums is unknown at this time.
The potential federal and state budgetary impacts of expanded coverage of GLP-1s for obesity in Medicare and Medicaid are unknown
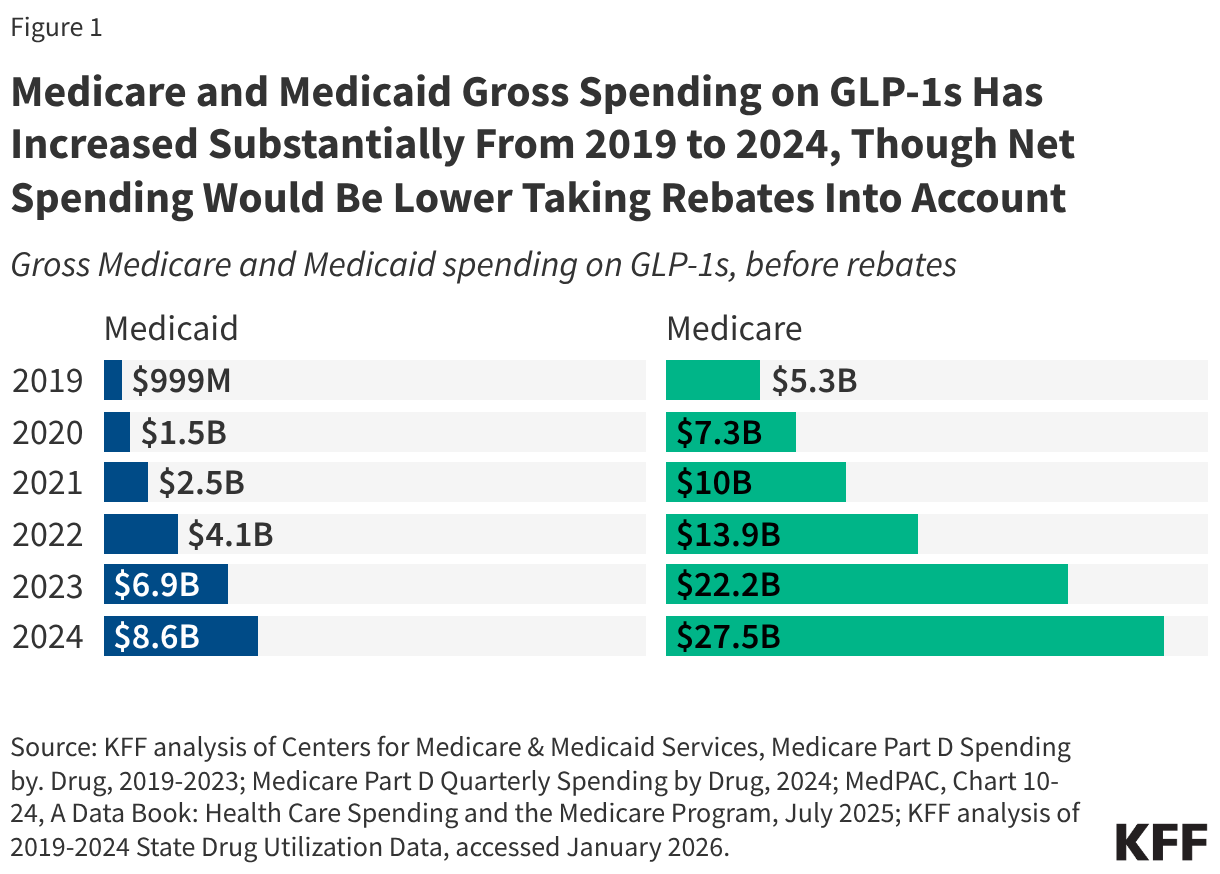
CMS documentation does not include potential federal or state budgetary impacts from either the BALANCE Model or the Medicare GLP-1 Bridge. Spending on GLP-1 drugs for currently covered uses under Medicare and Medicaid has increased substantially in a relatively short period of time and could increase further with expanded coverage of GLP-1s for obesity, even at the lower net prices for these medications under both demonstrations.
The law requires Innovation Center models to either maintain or reduce program expenditures. The model will test whether lower negotiated prices as applied to currently covered indications will lower program spending. It is unclear how the new negotiated prices under the model for state Medicaid programs (which remain confidential) compare to the net prices state Medicaid programs are currently paying for these drugs, but Medicaid already typically pays lower prices than other payers for prescription drugs. In general, without knowing what Medicaid and Medicare generally are currently paying for these drugs on net, it is uncertain whether the lower prices that will be made available to state Medicaid programs and Part D plans under the BALANCE Model for currently covered uses of GLP-1s will generate enough savings to offset the additional costs from expanded use of these medications for obesity. If state Medicaid programs estimate the costs from expanded use will outweigh the savings, initial state Medicaid participation may be limited, especially given recent state budget challenges and federal funding cuts.
Evaluations will also determine whether improvements in health related to the use of these drugs and associated reductions in healthcare utilization are significant enough to maintain or reduce health care costs in the Medicaid and Medicare programs, after taking into account expanded use and coverage of GLP-1s for the treatment of obesity. Even with lower prices, there is little evidence to date to suggest that the expanded use of GLP-1s will be offset by lower spending on other health care services in the short term, even though the drugs do provide significant health benefits to users.
The cost of the Medicare GLP-1 Bridge is not discussed in CMS documentation about this demonstration. The federal government is likely to incur additional spending under this demonstration due to paying for GLP-1s for obesity, which is not currently covered under Medicare. In addition, because the demonstration will operate outside the Part D benefit, the manufacturers won’t be responsible for providing the manufacturer price discount on eligible GLP-1s (10% in the Part D initial benefit phase and 20% in the catastrophic phase). While many prior section 402 demonstrations have had to conform to budget neutrality rules by the Office of Management and Budget (OMB), some demonstrations have been able to move forward without this requirement. Given the short timeframe of the GLP-1 demonstration, it is unlikely that there will be cost offsets from improved health due to increased GLP-1 use for obesity that can be documented.
This work was supported in part by Arnold Ventures. KFF maintains full editorial control over all of its policy analysis, polling, and journalism activities.
Recently, we saw health care costs rise to the top of the public’s list of economic worries, ahead of food, housing, utility costs and the cost of gas. I have long argued that voters see health primarily as a dimension of their economic concerns and that polls that rank it separately miss the mark, but we have seldom seen it at the top of the list of economic worries. It was propelled there by the debate about extending the ACA tax credits and the media attention that gave to health care affordability generally. Expect gas prices to rise and health care costs to fall on the list of affordability worries while the war in Iran lasts. Then health costs will return to the top or near the top of the list of economic worries when President Trump decides to declare the major hostilities over, the Strait of Hormuz is open, and gas prices come down.
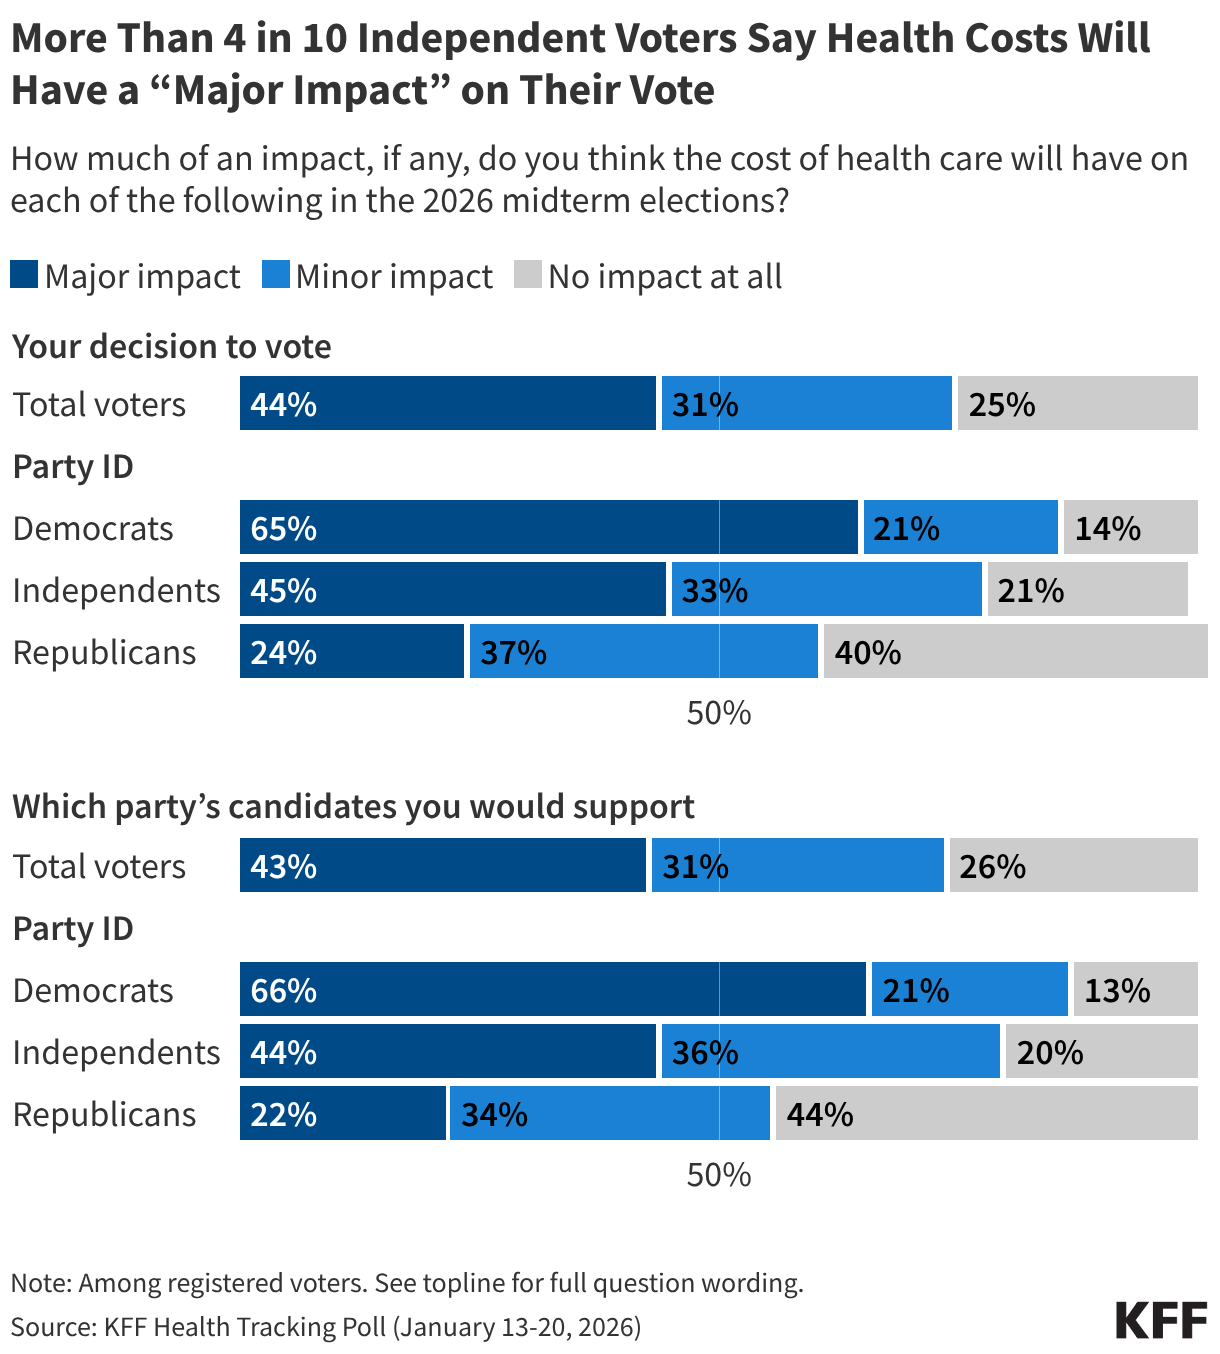
The war may cost Republicans some votes with independents and some MAGA Republicans opposed to foreign and “forever” wars, who may stay home and not vote, but health care costs have staying power as one of the top voter concerns. That’s especially true for independent voters. Democratic voters traditionally care a lot about health, but about eight in 10 independent voters whose votes may be more up for grabs now say health care costs will impact their interest in voting and the party they vote for. More than four in 10 independent voters say it will have a “major impact” on their vote. Seventy-six percent of independents, and even 43% of Republicans and 38% of MAGA supporters, also say Trump is not focusing enough on domestic affairs like addressing the cost of living.
Strong majorities of Democrats (62%) and independents (58%), and almost half of Republicans (46%) are also pessimistic about their health care costs, expecting them to increase in the next year. Health care costs always go up, but this feels like more than the usual pessimism, fueled now by broader affordability worries.
The struggles that enrollees in the ACA Marketplaces are having paying for their health care will also continue to bring more attention to health care affordability throughout the year. Our most recent survey showed that millions are not only dropping coverage and switching to higher deductible plans, but more than half say they are struggling to pay for food and other basic household expenses because of their new, higher health costs.
The war will likely have an impact on the midterms, which could be amplified for critics of “forever wars” if there is a follow-on action in Cuba. But expect the bread-and-butter issues to dominate again by the time the midterms roll around, with the affordability of health care solidly in the mix.
At the end of 2025, despite a government shutdown over the policy, the enhanced premium tax credits expired, decreasing financial assistance for subsidized Marketplace enrollees and contributing to significant increases in the Affordable Care Act (ACA) Marketplace costs for most enrollees overall. Amid the debates leading up to the expiration, KFF conducted a probability-based survey of 1,350 adults covered by ACA Marketplace plans in late 2025 to better understand their worries about potential cost increases for their health coverage. Now—without the enhanced tax credits in place—KFF re-interviewed 1,117 individuals (more than 80% of the original sample) to learn how they are navigating these changes to the ACA Marketplace.
This report is based on all 2025 Marketplace enrollees who took the follow-up survey, including returning Marketplace enrollees1, those who have left the Marketplace entirely for another type of coverage, and those who are now uninsured.
Summary of Findings
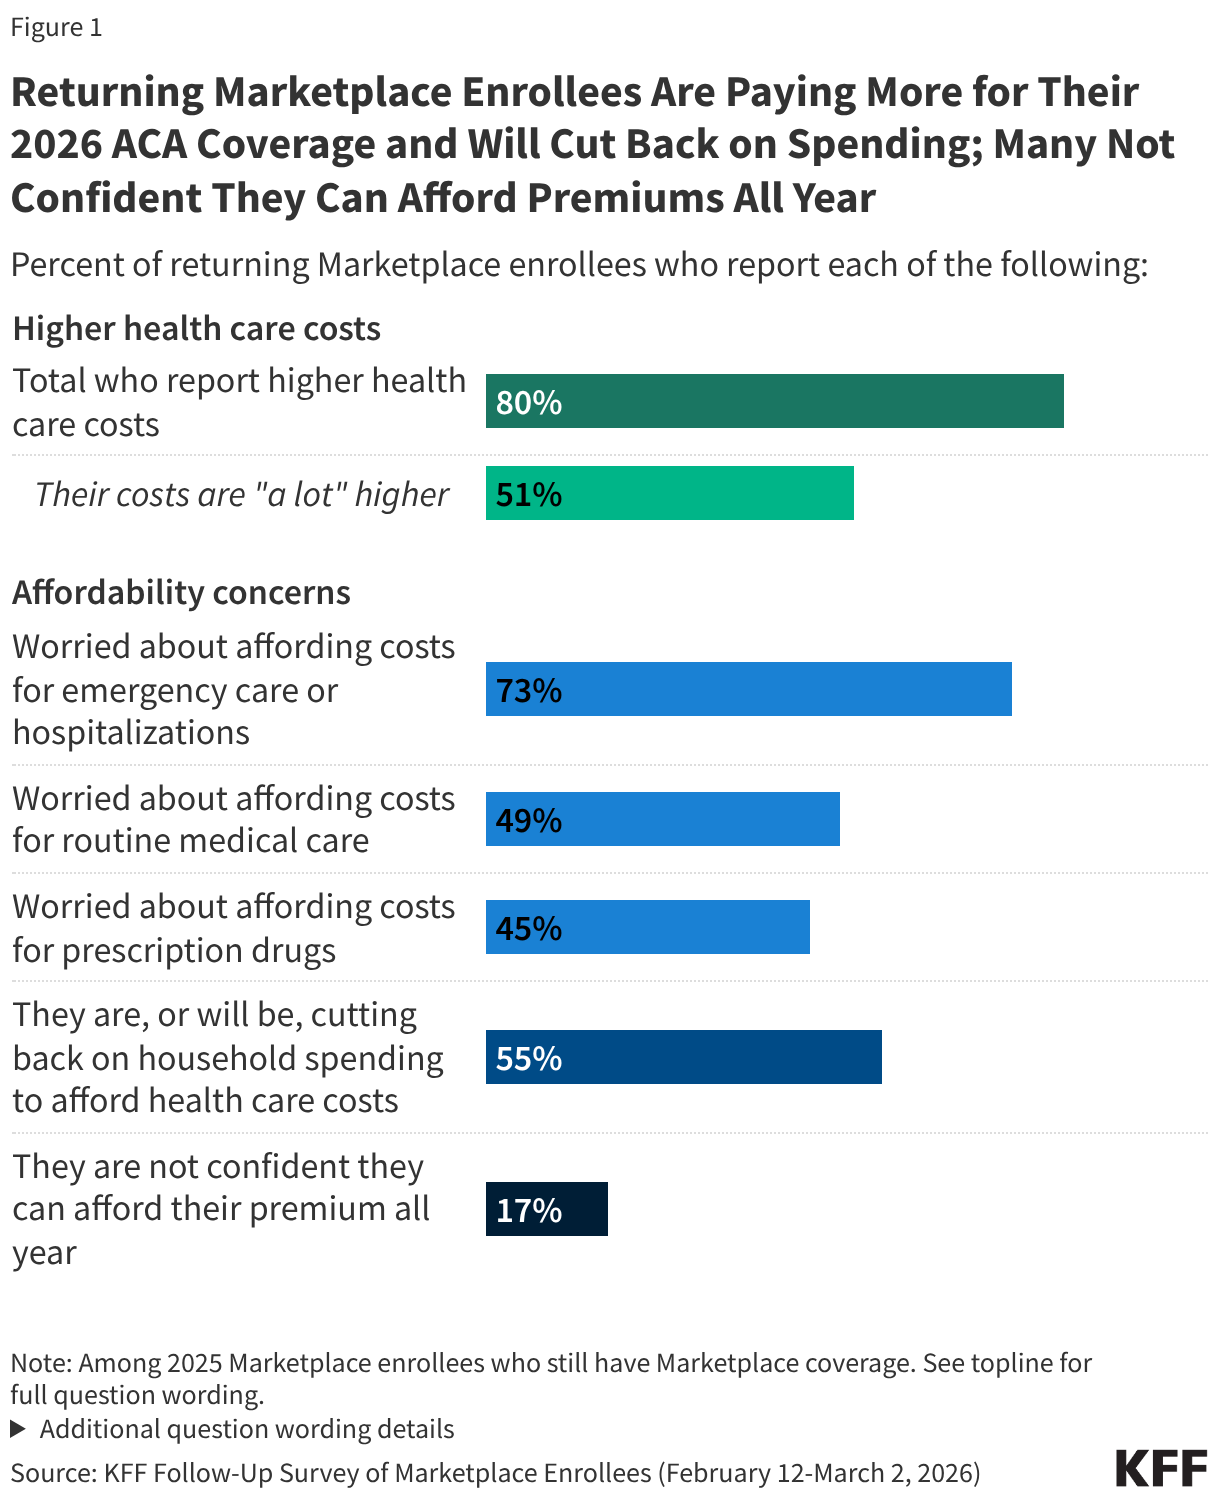
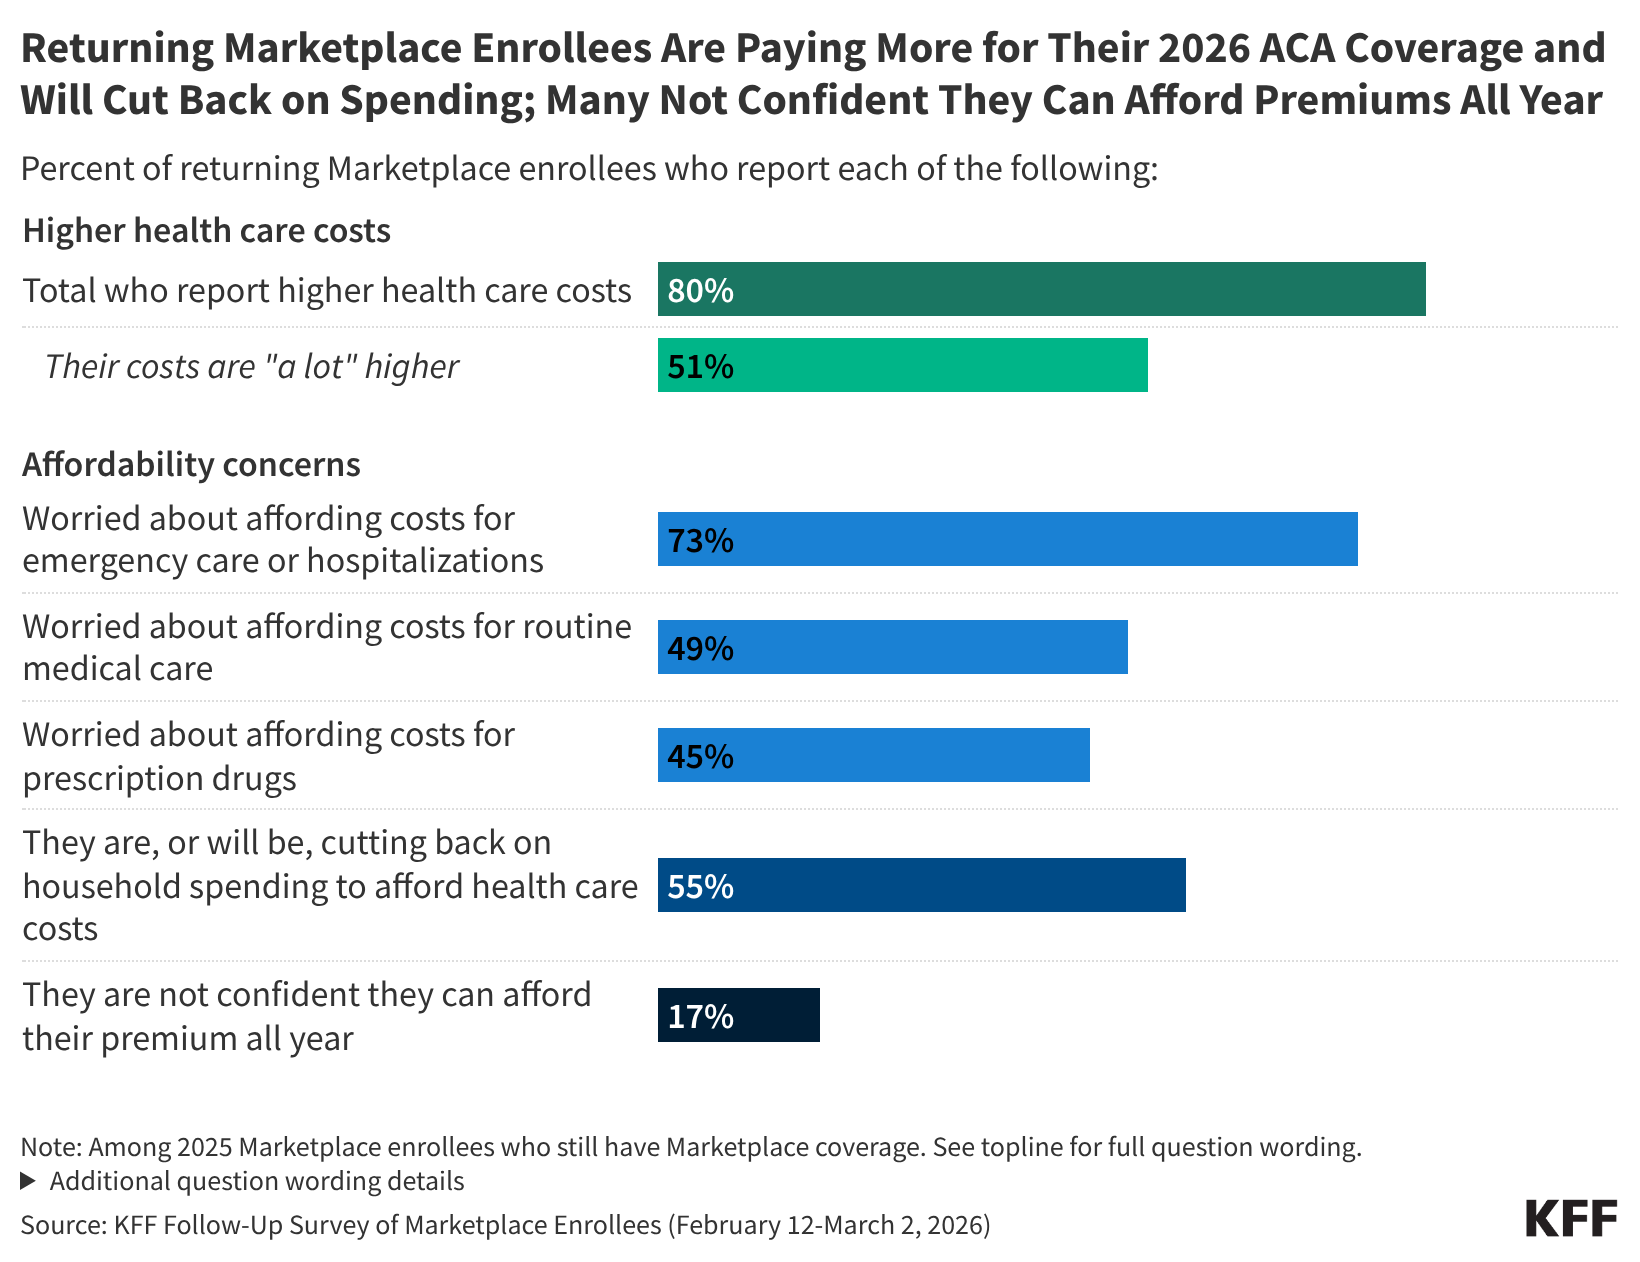
Half of those who have re-enrolled in ACA Marketplace coverage say their health care costs are “a lot higher” this year. Following the expiration of the enhanced premium tax credits and an open enrollment period that left many Affordable Care Act (ACA) Marketplace enrollees feeling “worried” and “angry,” most of those who have re-enrolled in Marketplace coverage now report paying more for coverage. A large majority (80%) of returning Marketplace enrollees say their 2026 plan’s premiums, deductibles, or coinsurance and co-pays are higher than last year, including half (51%) who say they are “a lot higher.”
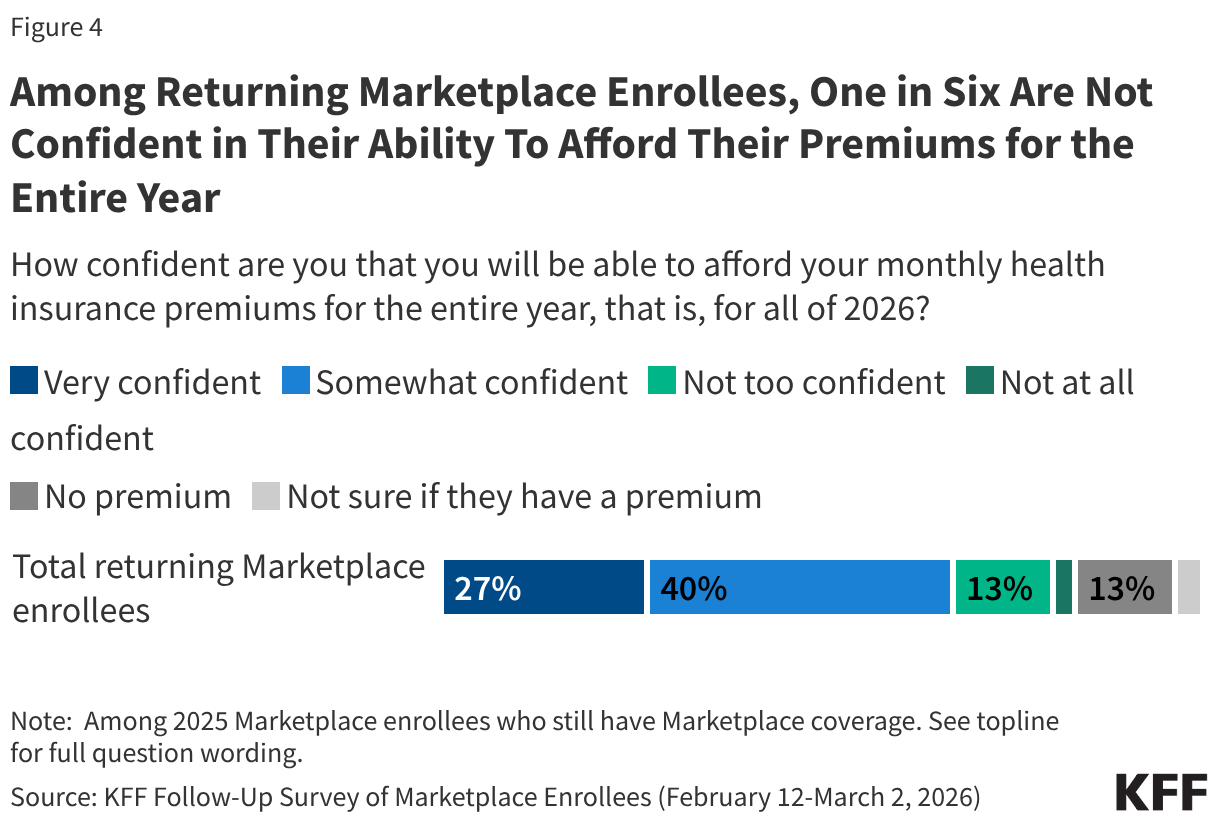
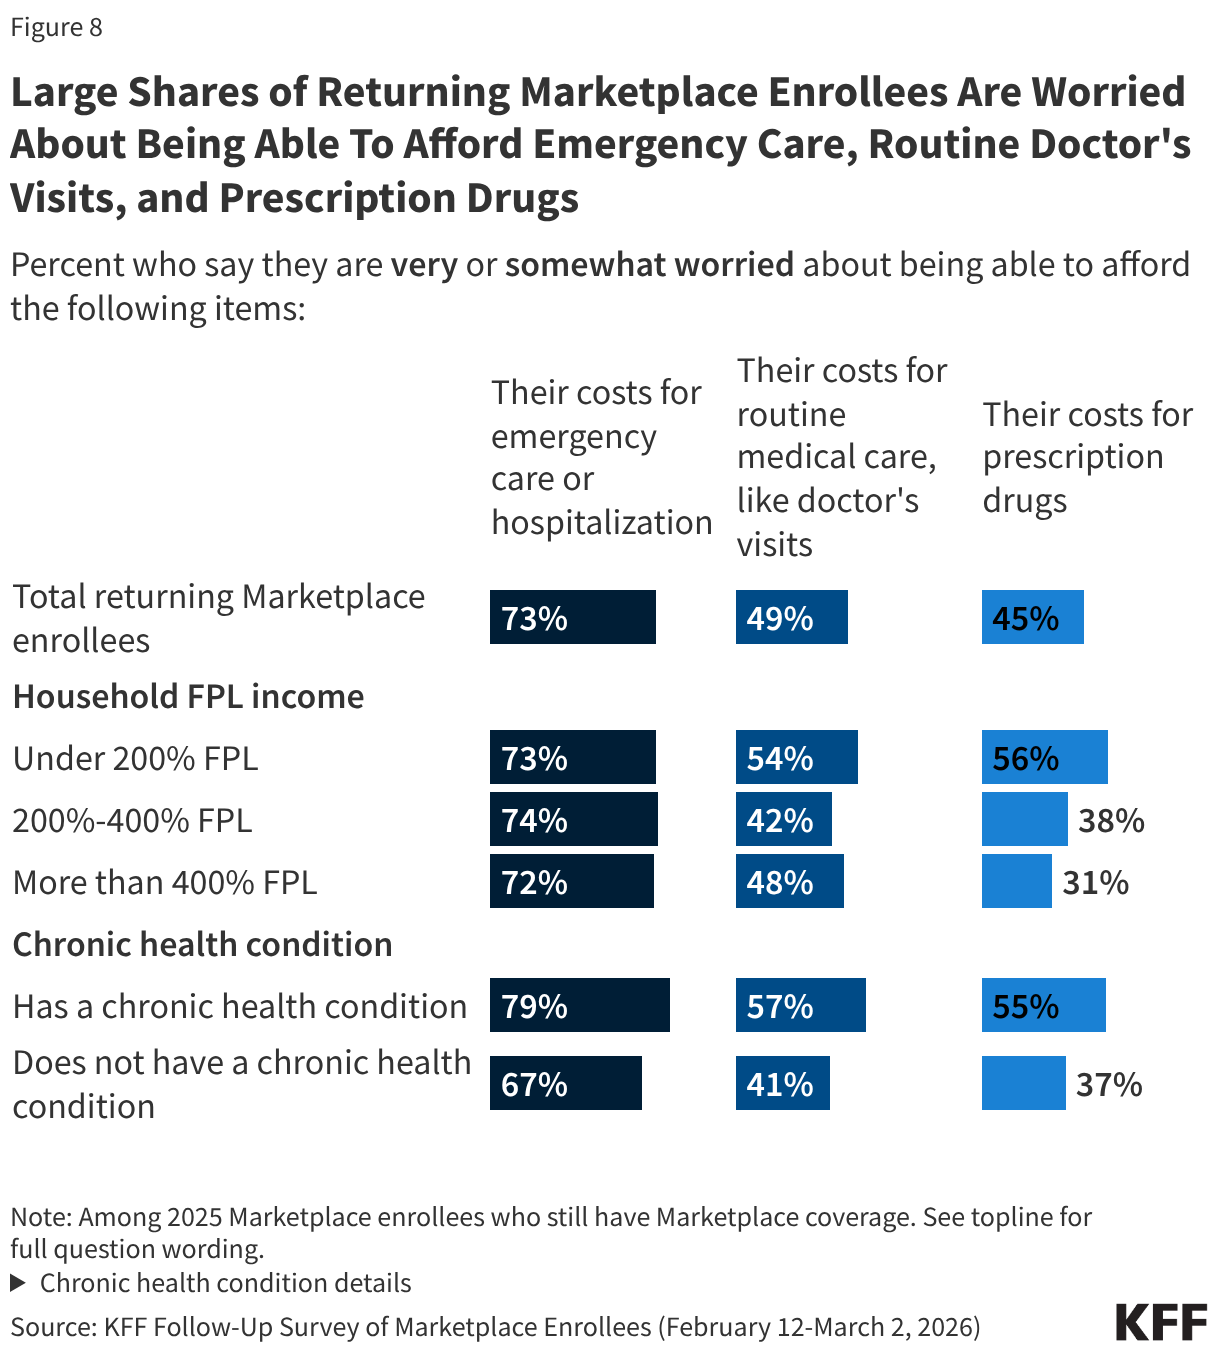
ACA Marketplace enrollees worry about affording their monthly premiums, as well as out-of-pocket expenses such as emergency care or routine medical visits. With many returning Marketplace enrollees reporting higher costs this year, majorities express worry about affording both routine and unexpected medical care. Three in four (73%) returning Marketplace enrollees say they are “very worried” or “somewhat worried” about being able to afford costs for emergency care or hospitalizations while about half are worried about affording costs for routine medical visits (49%) or prescription drugs (45%). Worries are even greater among those with lower incomes and those with chronic health conditions. In addition, one in six (17%) returning Marketplace enrollees say they are not confident they will be able to afford their monthly health insurance premium for the entirety of 2026. This is even as a quarter of those who switched plans say they downgraded their plan’s metal tier (e.g. from a Silver plan to a Bronze plan) in 2026, which generally have lower premiums but typically have higher out-of-pocket costs.
Health care costs are straining household budgets. Among 2025 Marketplace enrollees who have re-enrolled in Marketplace coverage, many report that their health care costs are putting pressure on household budgets. A majority (55%) of returning Marketplace enrollees say they are (or will be) cutting back spending on food or basic household items in order to afford the costs of coverage and care. The impact is even harder for returning enrollees with chronic health conditions, with 62% saying they are, or will be, cutting back on food and other household items in order to help them afford their health care costs.
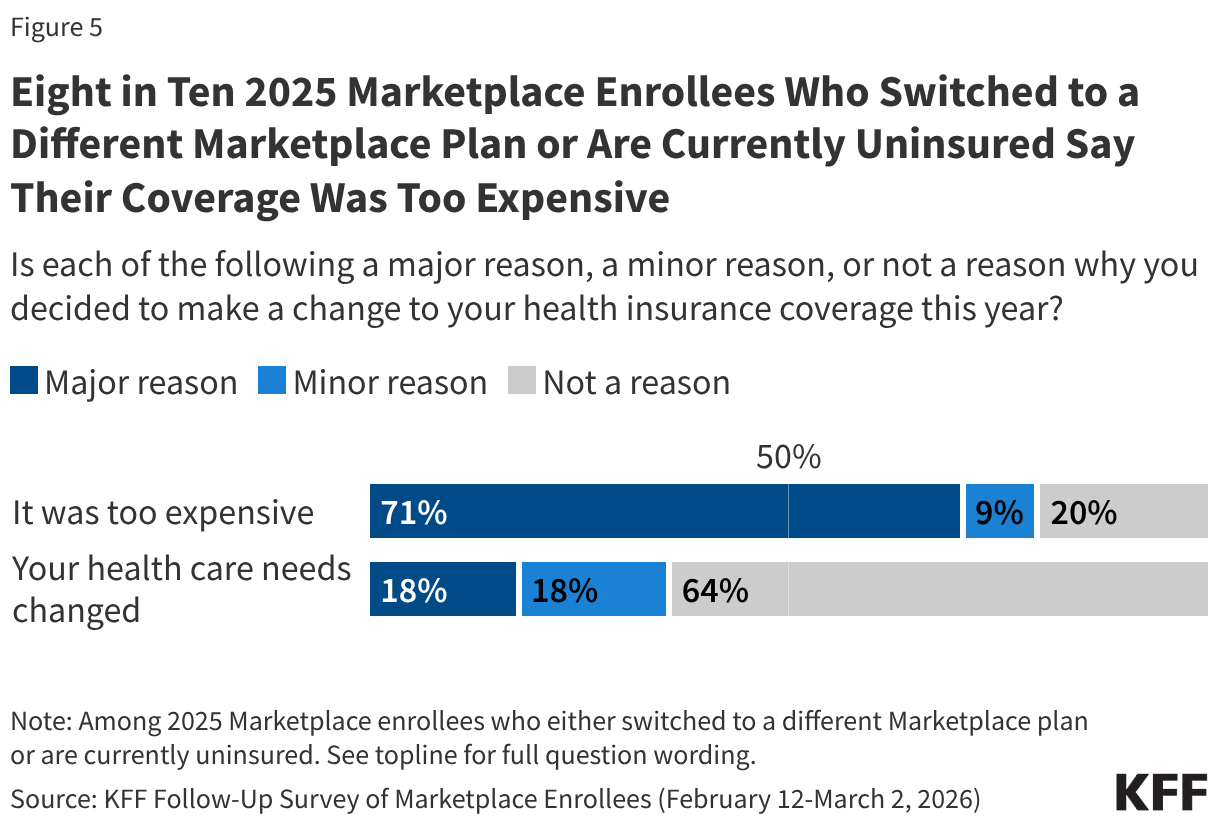
Some previous ACA Marketplace enrollees are now uninsured or have changed to a different Marketplace plan, citing costs as the major reason for that decision. One in ten (9%) 2025 Marketplace enrollees say they are now currently uninsured and three in ten (28%) say they switched to a different Marketplace plan. When asked the reasoning behind their change, a larger share say costs were the driver rather than changes to their health care needs. A 34-year-old man living in Texas put it this way, “The prices are simply too high. $800/month for the absolute cheapest plan for two people. Our income is $120k, so we don’t qualify for subsidies in Texas. I don’t think we could afford our mortgage if I had to pay for health insurance.”
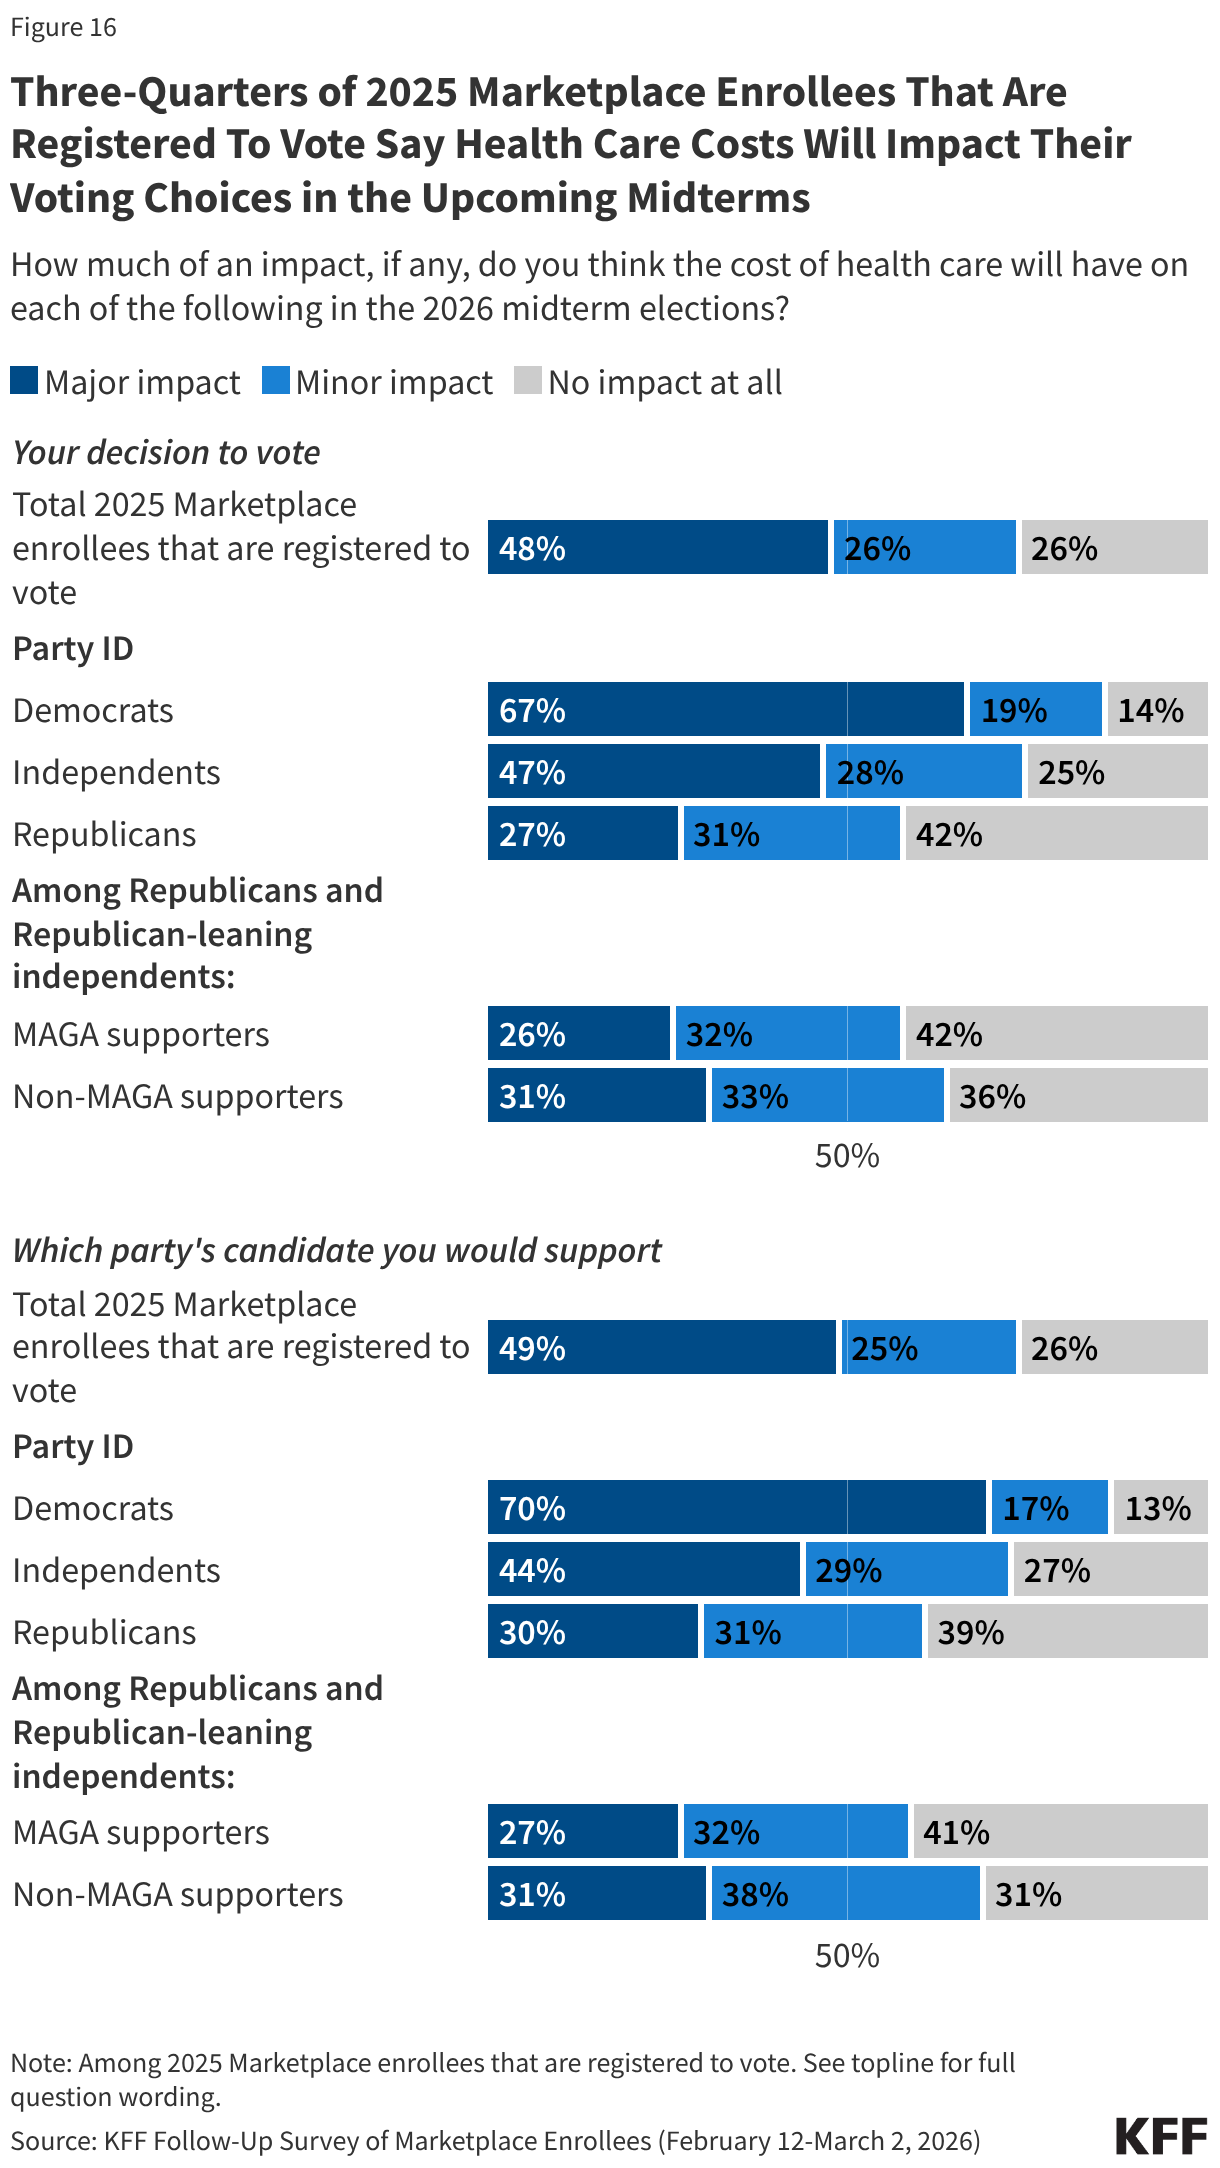
Health care costs may be a deciding factor for ACA Marketplace enrollees in the 2026 midterm elections. With health care costs front and center for 2025 Marketplace enrollees, many who are registered to vote say that the cost of health care will have a major impact on their decision to vote (48%) and which party’s candidate they will support (49%) in the midterm elections. The issue currently resonates more with Democrats, who are more than twice as likely as Republicans to say health costs will play a major impact on their decision to vote in the 2026 midterms (67% vs. 27%) and on which candidate they decide to vote for (70% vs. 30%).
Where Are They Now? Coverage Changes Among 2025 Marketplace Enrollees
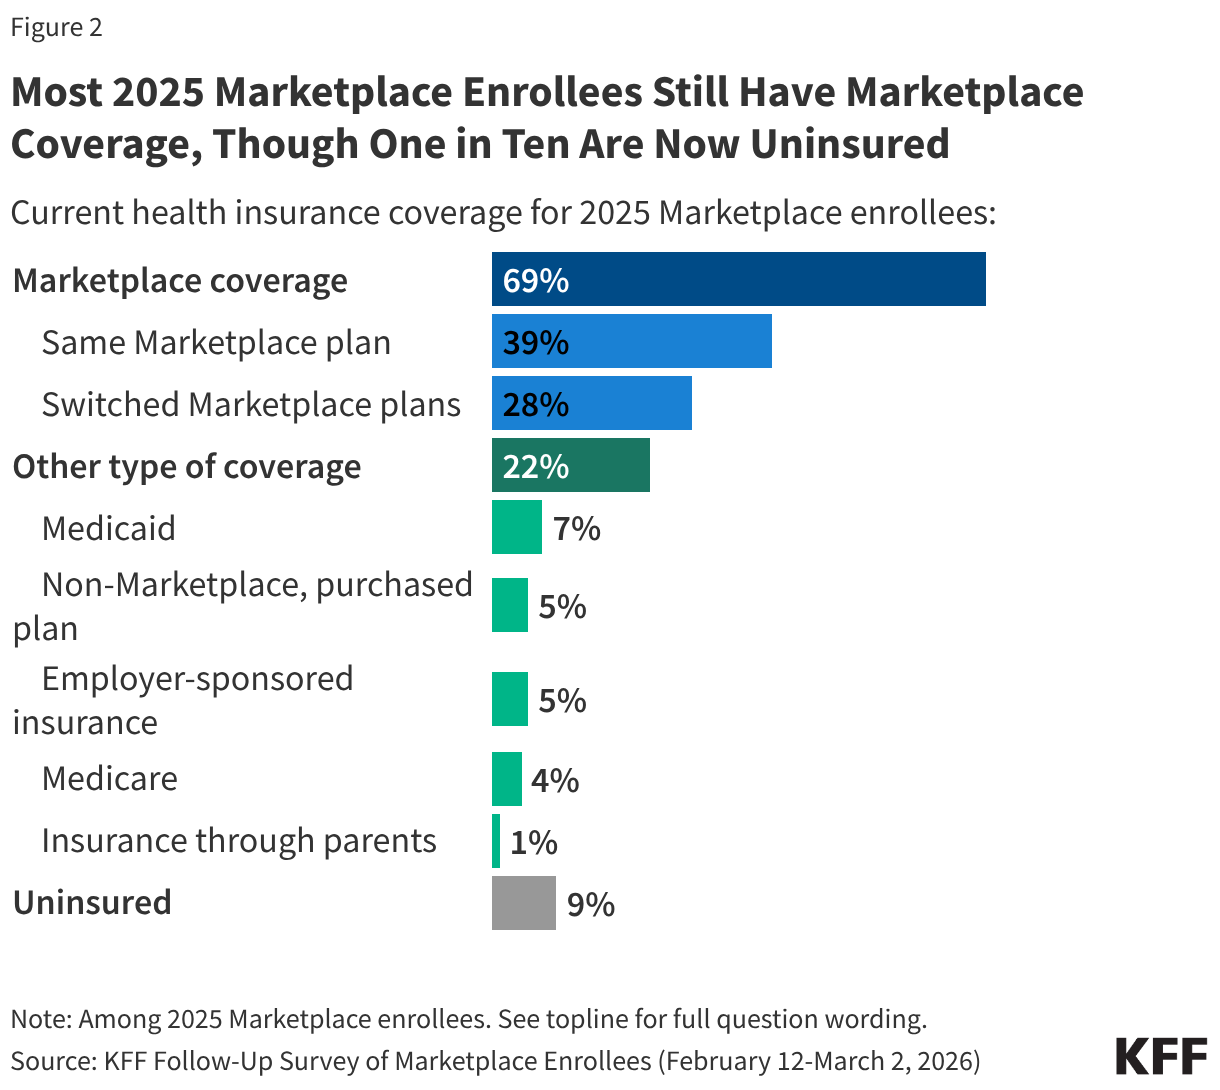
The Follow-Up Survey of ACA Marketplace Enrollees finds most (69%) 2025 enrollees say they have re-enrolled in Marketplace coverage for 2026, including four in ten (39%) who say they are enrolled in the same plan they had in 2025 and nearly three in ten (28%) who have switched to a different Marketplace plan. This is largely consistent with the 2025 survey findings in which a third said they would be “very likely” to look for a different Marketplace plan if their premiums doubled.
Additionally, about three in ten 2025 Marketplace enrollees now say they no longer have Marketplace coverage, including 22% who transitioned to a different source of coverage, such as through an employer, by becoming eligible for programs like Medicare or Medicaid, or say they have now purchased a non-Marketplace health insurance plan (some of which may provide less comprehensive coverage and have fewer consumer protections than Marketplace plans). One in ten (9%) 2025 Marketplace enrollees say they are currently uninsured. A large amount of churn on and off the Marketplace is normal as ACA Marketplace coverage is often a temporary source of coverage between jobs, and because income, age, and other circumstantial changes can make people newly eligible for other public programs such as Medicaid or Medicare.
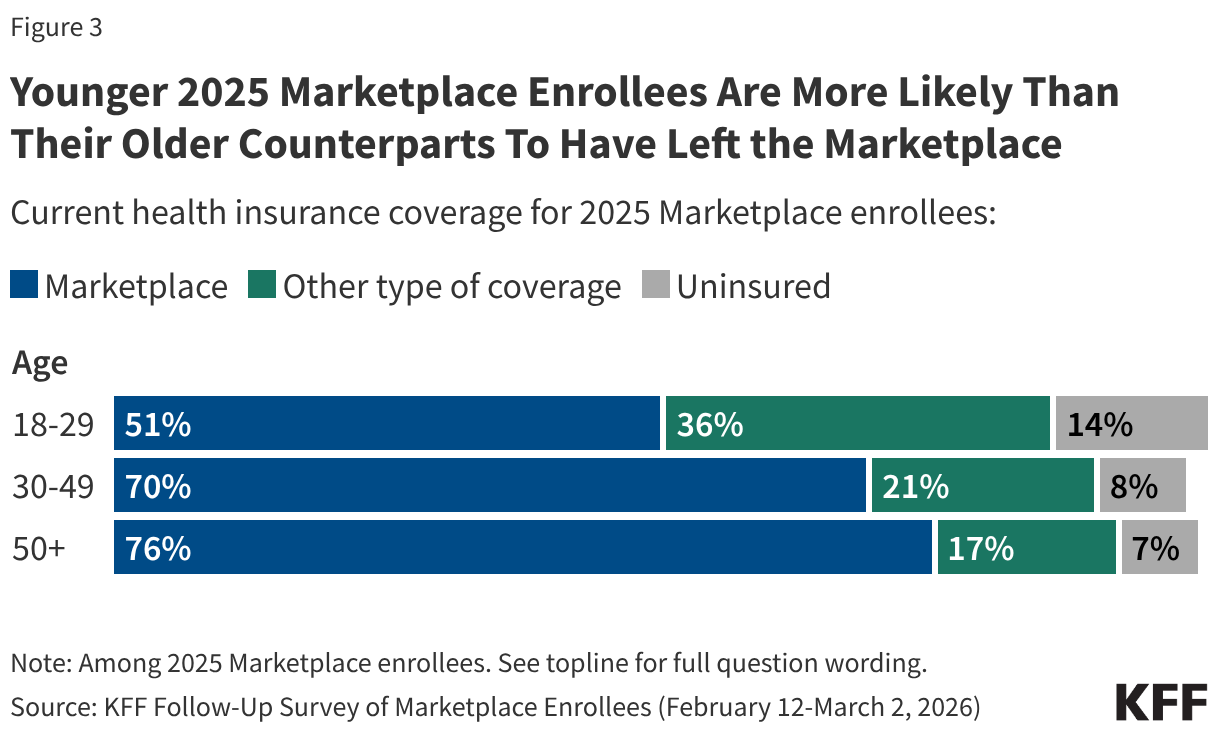
Notably, half (49%) of younger 2025 Marketplace enrollees between the ages of 18 and 29 report having left the Marketplace entirely, including 14% who say they are currently uninsured. In contrast, smaller shares of older 2025 Marketplace enrollees—ages 50 and up—say they are currently uninsured (7%). Additionally, younger 2025 enrollees are also more likely than their older counterparts to say they have left the Marketplace for another source of coverage—which would be expected with life changes such as starting a new job, getting married, or experiencing a change in income. Significant shares of younger adults having left the Marketplace in 2026 is consistent with previous KFF policy analysis on the expiration of the enhanced tax credits, which attributes part of this year’s increases to insurers anticipating healthier (e.g. younger) adults exiting the Marketplace, creating an enrollee base that is more expensive on average.
Among those who still have a Marketplace plan, one in six (17%) returning enrollees say they are “not too” or “not at all” confident they will be able to afford their insurance premiums for all of 2026. This may put them at risk of losing their Marketplace coverage at some point this year.
Additionally, 4% of returning Marketplace enrollees say they have yet to pay their first premium for 2026. Notably, returning enrollees who receive tax credits to help pay for their coverage are generally provided with a 3-month grace period for nonpayment of premiums, meaning most may have until the end of March to pay any premiums that are due before facing the retroactive termination of their health insurance coverage.
Costs Are a Major Reason Why Enrollees Switched to a Different Marketplace Plan or Dropped Coverage
Almost four in ten (37%) 2025 enrollees are either uninsured or switched to a different Marketplace plan. When asked the reasoning behind their change, a larger share say costs were the driver rather than changes to their health care needs. Eight in ten say they made a change to their coverage because it was too expensive, including seven in ten (71%) who say this was a “major reason” and one in ten (9%) who said it was a “minor reason.” Just over a third (36%) say changing health needs were a major or minor reason why they changed plans or dropped their Marketplace coverage.
Many 2025 enrollees who switched Marketplace plans this year say their previous plans’ premiums increased dramatically when selecting coverage for 2026. Additional reasons for changing plans include their old plans no longer being available and general dissatisfaction with their previous plan.
In Their Own Words: What is the main reason you switched to a different Marketplace plan this year?
“The cost of the same plan I had in 2025 tripled in price to $360/month. So I went with a different plan that cost less. But even it was higher than the plan I had in 2025.” – 62-year-old man, Wisconsin
“The price went from 2k to 3500 for a household of 4 people.” – 37-year-old man, Florida
“Income exceeded the subsidy limit, forcing us to pay the full cost, so we switched down to a bronze from a gold plan. Even doing that our premiums are 3 times what they were in 2025, with lower plan features and a higher deductible.” – 56-year-old man, Texas
“Cost. By switching to Bronze, I would receive a tax credit that covered my plan. If I had stayed on my Silver plan, I would’ve had to pay out-of-pocket, which my budget does not allow for.” – 26-year-old woman, Montana
“In 2025 I had the elite bronze plan. The monthly premium cost of the plan I had in 2025 went up, the PCP and prescription copays went up, and the deductible went up almost $4000. To keep my out of pocket expenses the same and given my prior history…I had to drop to the everyday bronze with a much larger deductible and just hope that I continue not to actually need anything unexpected.” – 55-year-old man, South Carolina
Health Care Costs Weigh Heavily on the Now Uninsured
Among the 9% of 2025 enrollees who say they are currently uninsured, survey responses indicate that the cost of health care played a major role in their decision to drop coverage, and many from this group report worrying about affording medical care.
In Their Own Words: What is the main reason you are currently without health insurance coverage?
“The end of ACA subsidies caused a huge increase in premiums, the cost of which I could not afford.” – 63-year-old man, California
“Even though I make some income (too much for subsidies, even last year), the increase is so high even for those without subsidies. I simply cannot afford to pay $1,200 a month for insurance. It used to be high premiums meant low deductibles and copays, but not anymore. This is ridiculous. $1,200 for a healthy person, and an $8,000 deductible. Really?” – 56-year-old woman, Illinois
“[I am] self-employed and [there are] no cheap health plans.”– 24-year-old man, Florida
“Without the subsidy, I cannot afford the premium payments.”– 54-year-old man, Texas
“The prices are simply too high. $800/month for the absolute cheapest plan for two people. Our income is $120k, so we don’t qualify for subsidies in Texas. I don’t think we could afford our mortgage if I had to pay for health insurance. $800/month is 8 self pay doctors visits a month. If I have a catastrophic health event it makes more sense for me to just declare bankruptcy than it would be to be delinquent on other payments.” – 34-year-old man, Texas
Many 2025 enrollees who are now uninsured cite fears about accessing and affording care in the case of unexpected medical emergencies. Some who have significant health issues say their main worry about not having health insurance is being unable to afford necessary medications and treatment.
In Their Own Words: What is your main worry, if any, about not currently having health insurance?
“Not managing ongoing health issues and pre-existing conditions.” – 48-year-old woman, Colorado
“Everything. Can’t afford insurance can’t afford health care without insurance so basically just hoping and praying I don’t get sick or have any major issues pop up.” – 38-year-old man, Alabama
“We are 59 and 61 yrs old. We need healthcare. And now we will either avoid seeing a dror go bankrupt.” – 59-year-old woman, Virginia
“I’m in my ‘50s and have some health concerns that I won’t be able to address this year.” – 55-year-old man, Idaho
Health Care Costs Contribute to Affordability Worries and Challenges Among Returning Marketplace Enrollees
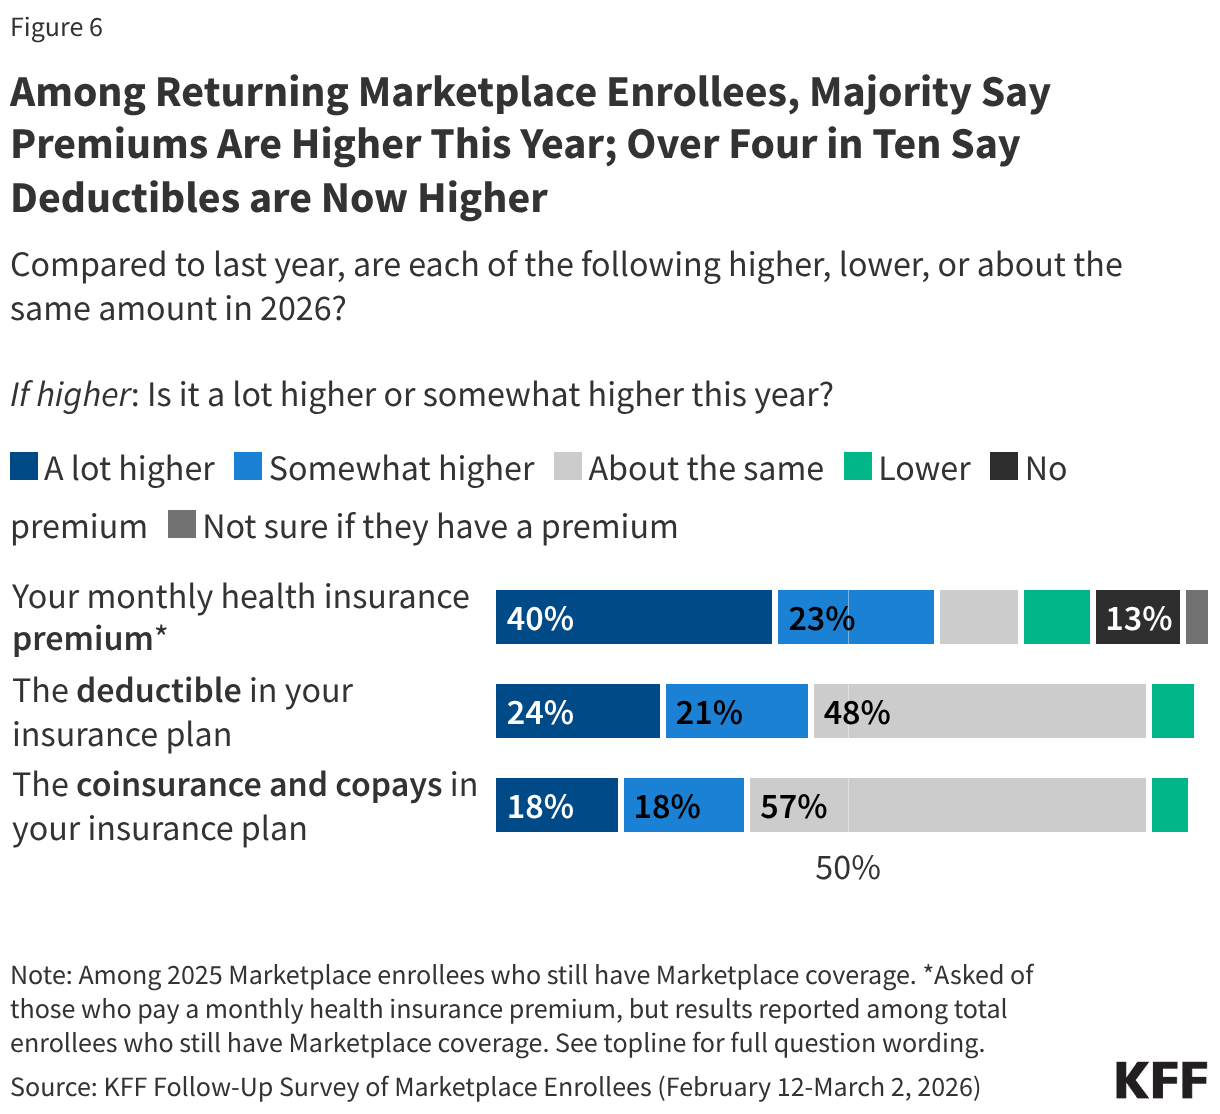
Following the expiration of the ACA enhanced premium tax credits in December 2025, a large majority (80%) of returning Marketplace enrollees say their health care costs are higher this year compared to 2025. This includes half (51%) of returning enrollees who say their health care costs—whether it be their premiums, deductibles, and/or their coinsurance and co-pays—are “a lot higher” compared to last year.
About six in ten (63%) returning Marketplace enrollees say their monthly health insurance premium is higher than 2025, including 40% who say it is “a lot higher.” In addition, nearly half say their deductibles are higher (45%, including 24% who say they’re “a lot higher”), and one-third say their coinsurance and co-pays are higher compared to last year (36%, including 18% “a lot higher”).
Increases in insurance plan cost-sharing are pronounced among those who say they switched their Marketplace plan this year. Over half (54%) of returning enrollees who switched plans say their deductibles are higher this year compared to last year (including 34% who say “a lot higher”), and an additional four in ten (42%) say their coinsurance and co-pays are higher (25% “a lot higher”). This likely reflects the fact that some enrollees switched to lower tier Bronze plans which may mitigate some of the increase in premiums but typically have higher out-of-pocket costs. Overall, a quarter (26%) of plan switchers say they downgraded their metal plan (e.g. from a Silver plan to a Bronze plan) in 2026.
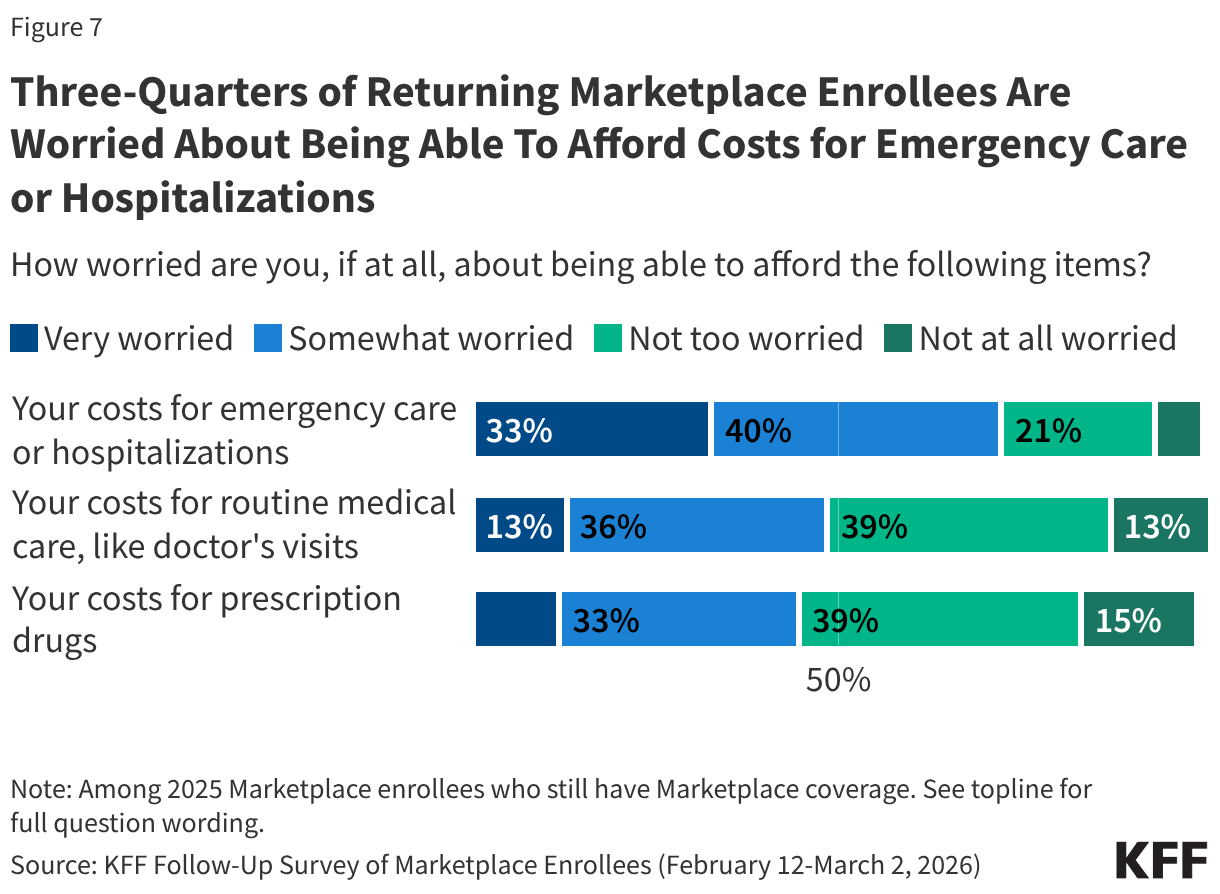
While most 2025 Marketplace enrollees say they still have Marketplace coverage in 2026, having insurance does not insulate them from worrying about the costs of accessing care. About three in four (73%) returning Marketplace enrollees say they are “very worried” or “somewhat worried” about being able to afford costs for emergency care or hospitalizations while about half are worried about affording costs for routine medical visits (49%) or prescription drugs (45%).
At least seven in ten returning Marketplace enrollees across income groups say they are worried about being able to afford costs for emergency care or hospitalization. However, those with lower incomes are more likely than their higher-income counterparts to worry about being able to afford prescription drugs. Those with chronic conditions are more likely than those without such conditions to worry about affording emergency care, routine care, and the cost of prescription medications.
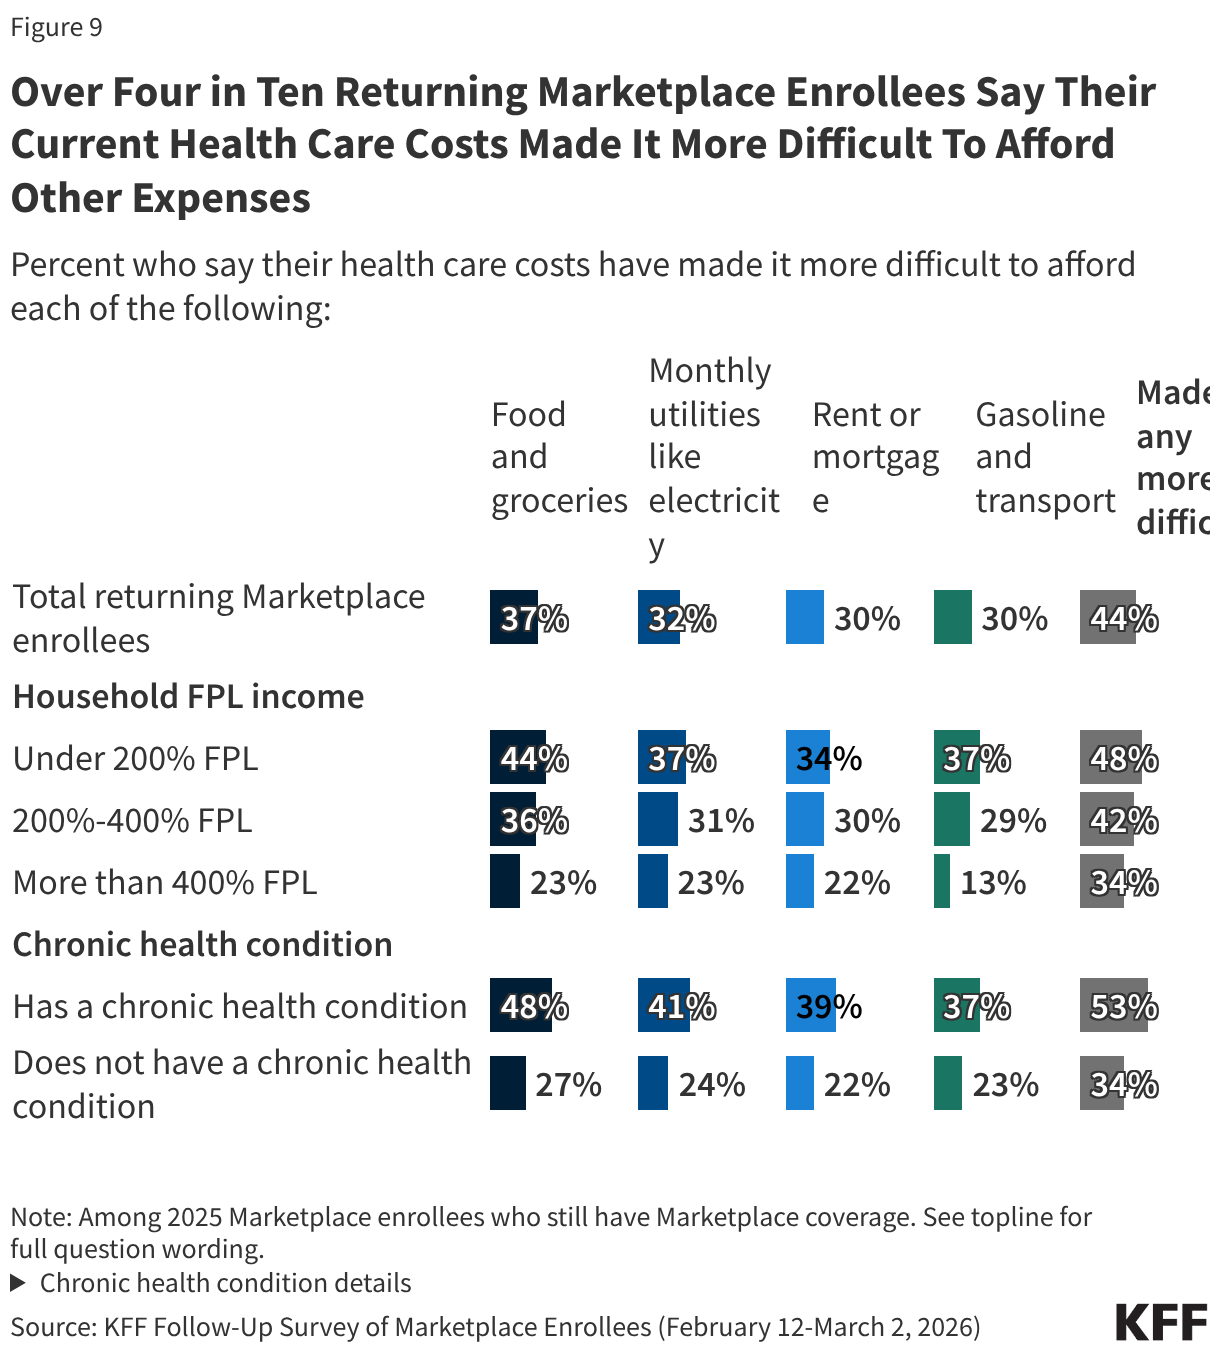
Rising health care costs can place considerable pressure on household budgets and create additional financial strain. Just over four in ten (44%) returning Marketplace enrollees say their health care costs have made it harder to afford other expenses, including over a third (37%) who say it has made it more difficult to afford food and groceries and about three in ten who say it has made it more difficult for them to afford their monthly utilities (32%), their rent or mortgage (30%), or gasoline or other transportation costs (30%)
About half of returning Marketplace enrollees with lower household incomes and those with chronic health conditions report that their health care costs are placing financial strain on other expenses.
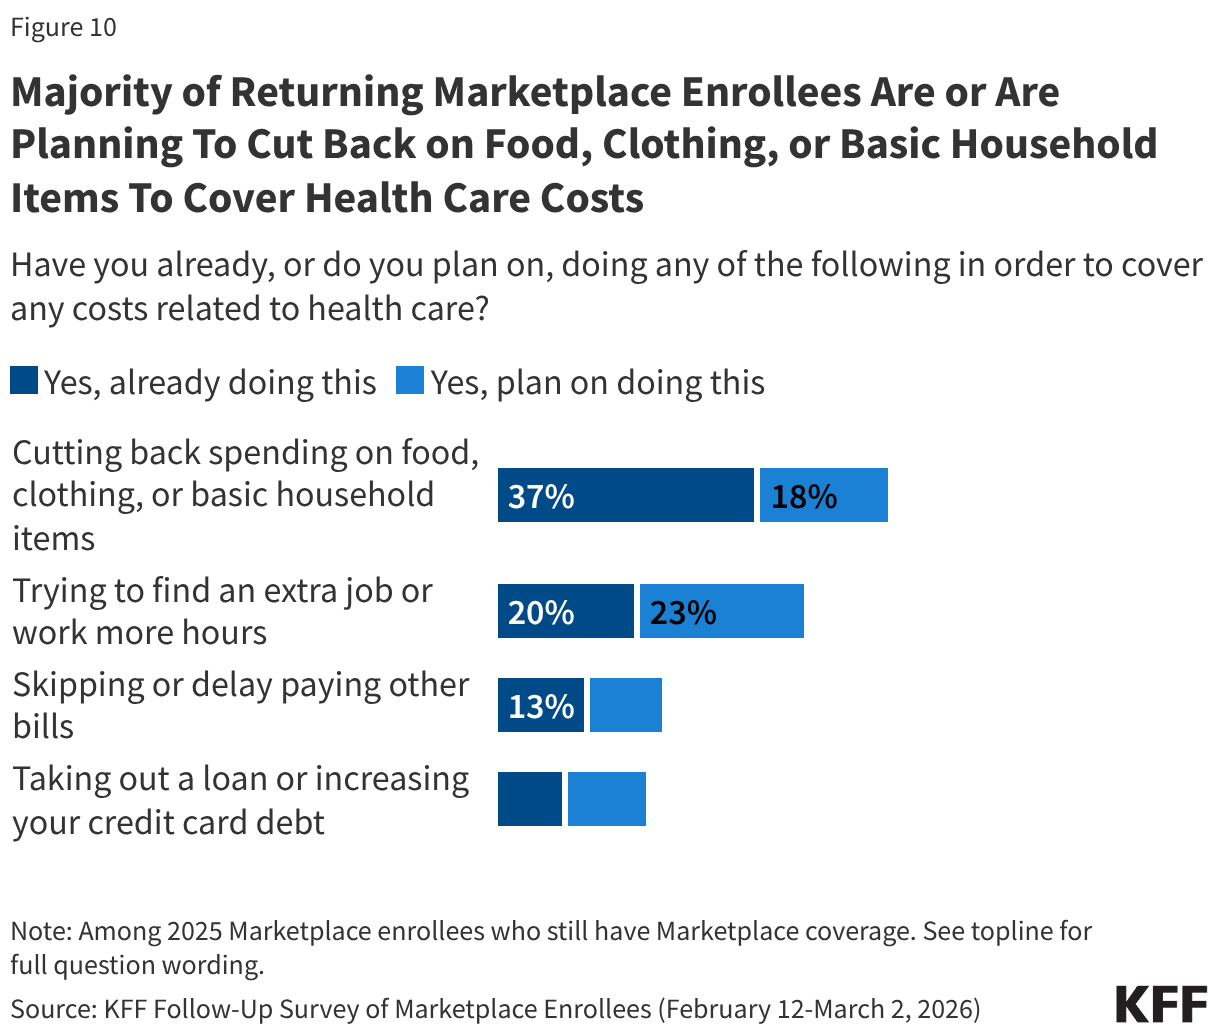
A majority (55%) of returning Marketplace enrollees say they have already, or are planning to, cut back spending on food or basic household items in order to cover any health care related costs. Around four in ten (43%) say they have already or are planning to find an extra job or work more hours to cover health expenses, while about two in ten are skipping or delaying paying other bills (23%) or taking out loans or increasing their credit card debt (20%). Notably, while one in five returning enrollees say they are already looking for another job or trying to find more hours, an increase in income could help them afford their premium or deductible payments, but it could also mean they become eligible for less financial assistance.
Returning Marketplace enrollees with chronic conditions are among the most likely to report taking steps to cover their costs, with about six in ten (62%) saying they have or plan to cut back on spending, half (52%) saying they have or plan to work more, a third (33%) saying they will skip or delay paying bills, and a quarter (26%) saying they will take out a loan or increase their credit card debt.
In Their Own Words: What changes or actions have you taken or think you may take in order to afford your health care costs this year?
“Attempt to pay off loans to free up more monthly money, budget groceries more tightly, put hospital debt on a payment plan.” – 24-year-old woman, Kentucky
“Cut back on food expenses, choose cheaper & fewer dining out experience, watch heat & AC usage even more.” – 54-year-old woman, California
“Attempt to use as little health care as possible. Make sure our doctors and hospitals are covered by the insurance. Talk with our doctors to verify that ordered treatments and/or drugs are really necessary. Discuss with providers/pharmacies to see if self-pay may be cheaper than using insurance in particular cases.” – 56-year-old man, Texas
“Shopping for cheaper groceries, not buying clothes, avoiding getting sick, not being as social.” – 63-year-old woman, California
“Pare back expenses as much as possible.” – 39-year-old man, Iowa
“Limit going to the doctor. I can’t afford the medications prescribed so I try to find over the counter substitutions.” – 54-year-old woman, Texas
“My grocery budget and fun budget are smaller so we can afford the premium.” – 38-year-old woman, Colorado
“I may have to get part-time employment. I may have to get a job after being retired.” – 60-year-old woman, Florida
Open Enrollment Process Left Many Marketplace Enrollees Worried and Angry
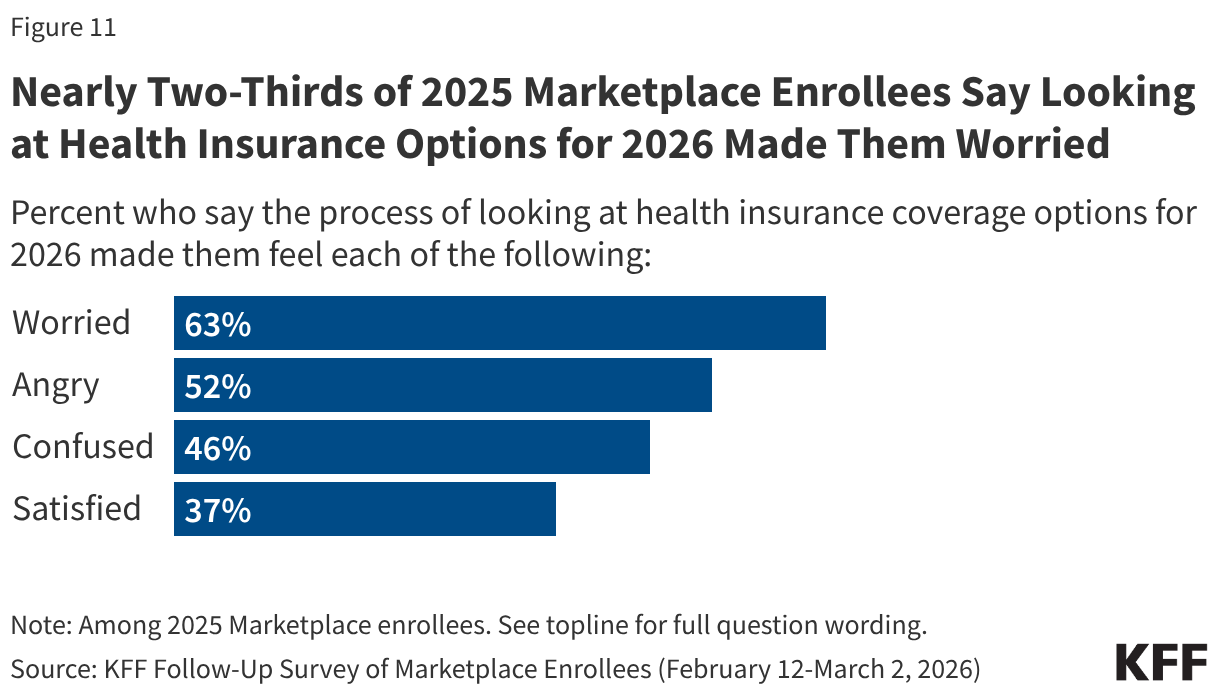
Following the expiration of the enhanced premium tax credits for ACA Marketplace coverage, many 2025 Marketplace enrollees say they felt worried or angry as they went through the process of evaluating their health insurance options for 2026. Nearly two-thirds (63%) of 2025 Marketplace enrollees say they felt “worried” during the process of looking for coverage while about half (52%) say they felt “angry.” Nearly half (46%) say the process made them feel “confused,” while nearly four in ten (37%) say they were “satisfied” during the process of looking for insurance coverage for this year.
Reactions to the Expiration of Enhanced Premium Tax Credits
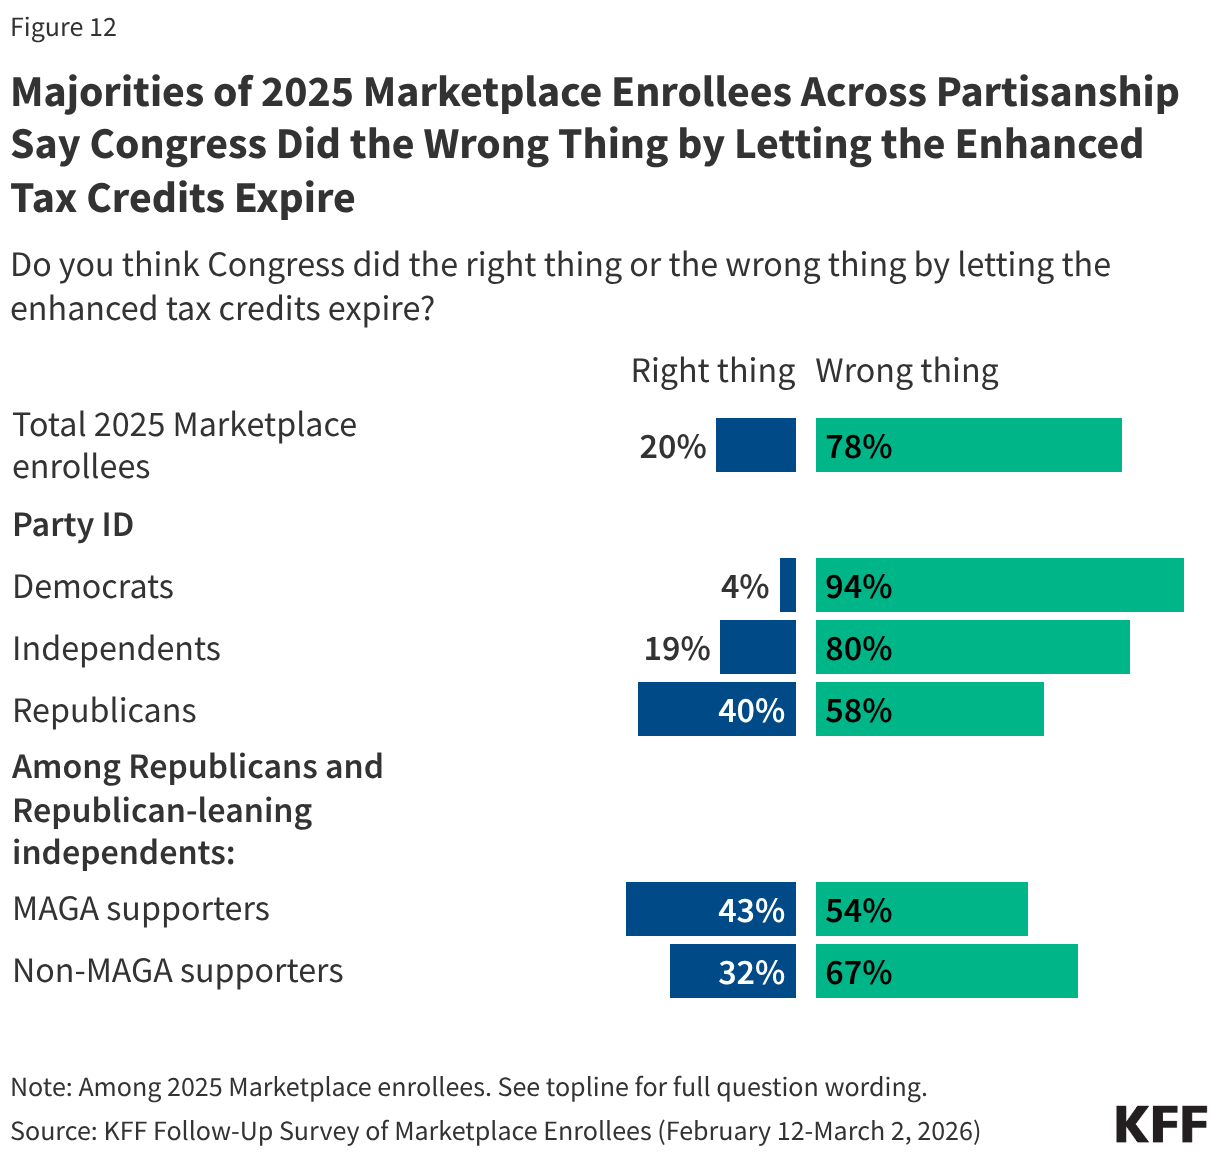
In a recent KFF Health Tracking poll, a majority of the public overall said Congress did the wrong thing by letting the enhanced premium tax credits for people who buy their insurance on the ACA Marketplace expire. Unsurprisingly, 2025 Marketplace enrollees share this sentiment, with eight in ten (78%) saying that Congress did the wrong thing by letting the credits expire, while two in ten say Congress did the right thing.
Majorities of 2025 Marketplace enrollees across partisanship agree that Congress did the wrong thing, including nearly all Democrats (94%), eight in ten independents, and six in ten Republicans (58%). Even among Trump’s base—Republicans and Republican-leaning independents who support the MAGA (Make America Great Again) movement—a majority (54%) say that Congress did the wrong thing by letting the credits expire.
When asked how they feel about the expiration of the enhanced premium tax credits, many 2025 Marketplace enrollees express anger, frustration, and disappointment. While some are fine with the expiration or note that it has not impacted them, many are upset at the rise in their own insurance costs and the government’s failure to extend the credits.
In Their Own Words: How do you feel about Congress letting the enhanced premium tax credits for the Affordable Care Act (ACA) expire?
“Angry. They get affordable good coverage even when they aren’t doing ANYTHING. We struggle to pay for health insurance. And they gut the ACA without offering any alternative.” – 60-year-old independent woman, California
“I am okay with it. It was not going to be able to sustain itself so it needed to happen.” – 48-year-old Republican woman, Florida
“Evil on the part of republicans. Absolutely ineffectual on the part of democrats.” – 33-year-old Democratic man, Washington
“It’s a disgrace that families are being put in this position to chose between health insurance and all other household needs.” – 42-year-old Democratic woman, Pennsylvania
“It could hurt some people but the impact to me is minimal.” – 56-year-old independent man, California
“There should have been a gradual decrease versus a sudden cut off or more communication so that people could prepare as needed and advocate where possible.” – 44-year-old Democratic woman, California
“I feel as if it’s unfair to those who make too much to be able to receive Medicaid. We are getting penalized for making more money than poverty level.” – 26-year-old independent woman, Florida
“It needs to expire and pharmaceutical companies need to have a cap on prices. They should not be able to charge so much. Also, put a cap on insurance company premiums too.” – 47-year-old independent woman, Georgia
“It has had a major financial impact on my already financially stressed household as I am fully disabled in a wheelchair and unable to work and also unable to receive disability or social security.” – 58-year-old Republican woman, Texas
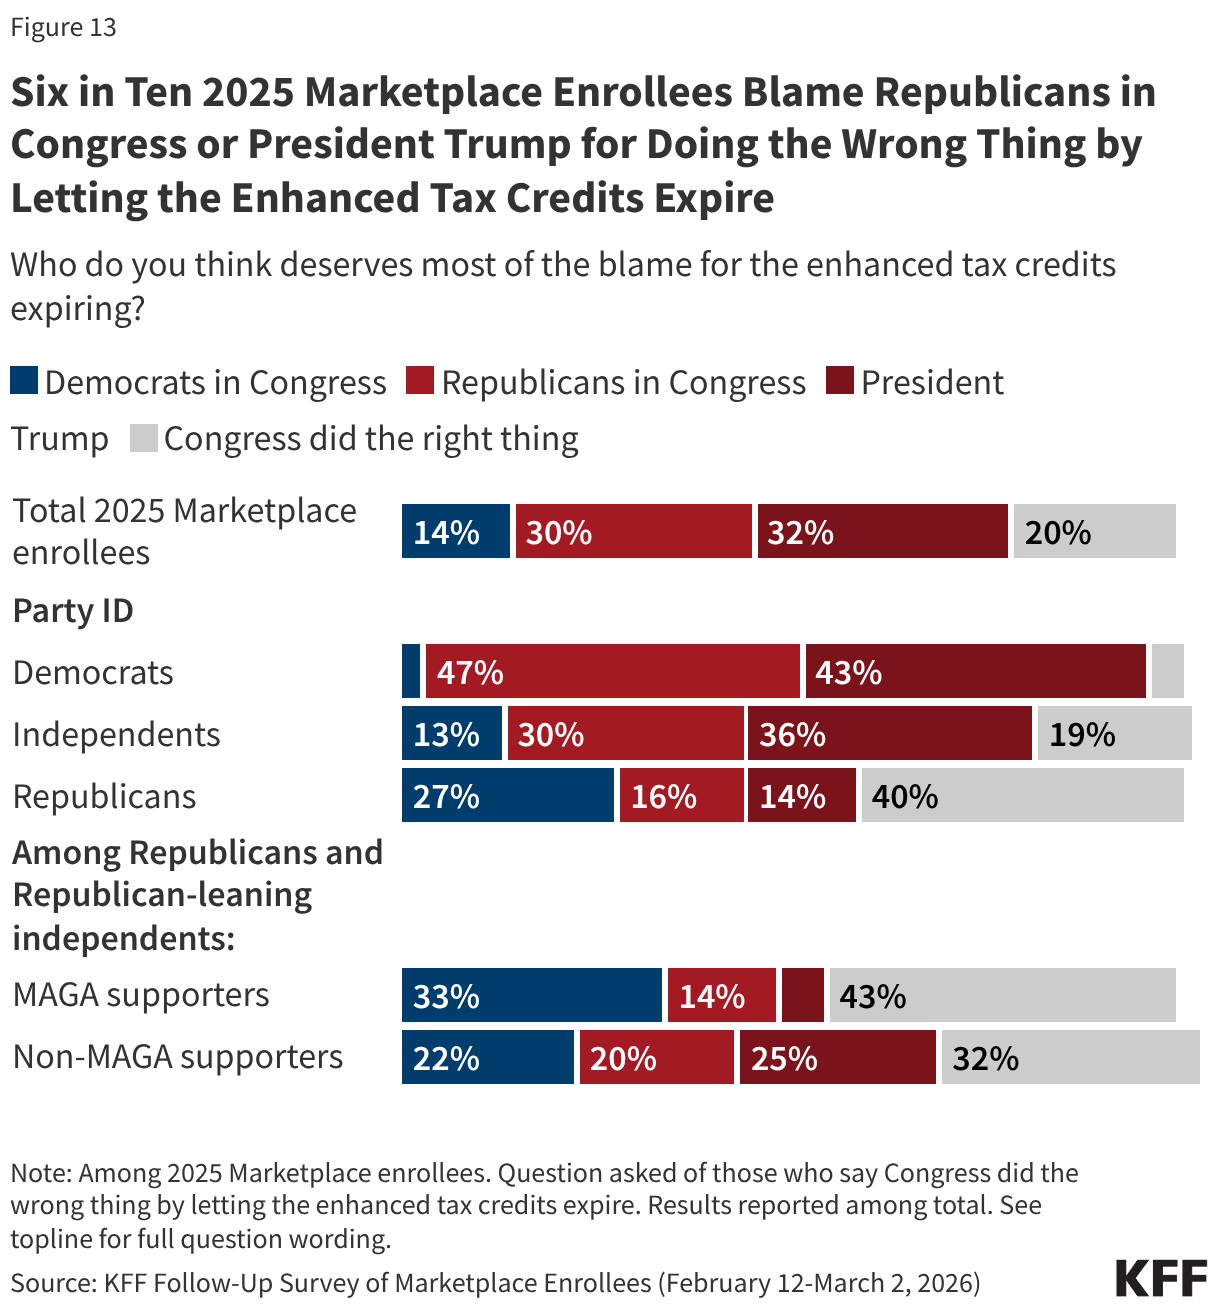
Among all 2025 Marketplace enrollees, about six in ten (62%) place the most blame on either President Trump (32%) or Republicans in Congress (30%), while a smaller share (14%) say Congressional Democrats deserve the most blame. Two in ten think Congress did the right thing by letting the tax credits expire.
While very few Democratic 2025 Marketplace enrollees blame their own party (3%) for the expiration of the enhanced tax credits, three in ten Republicans, including two in ten MAGA-supporting Republicans, place the most blame on either President Trump or Republicans in Congress.
Potential Political Impacts of Higher Health Care Costs Among Marketplace Enrollees
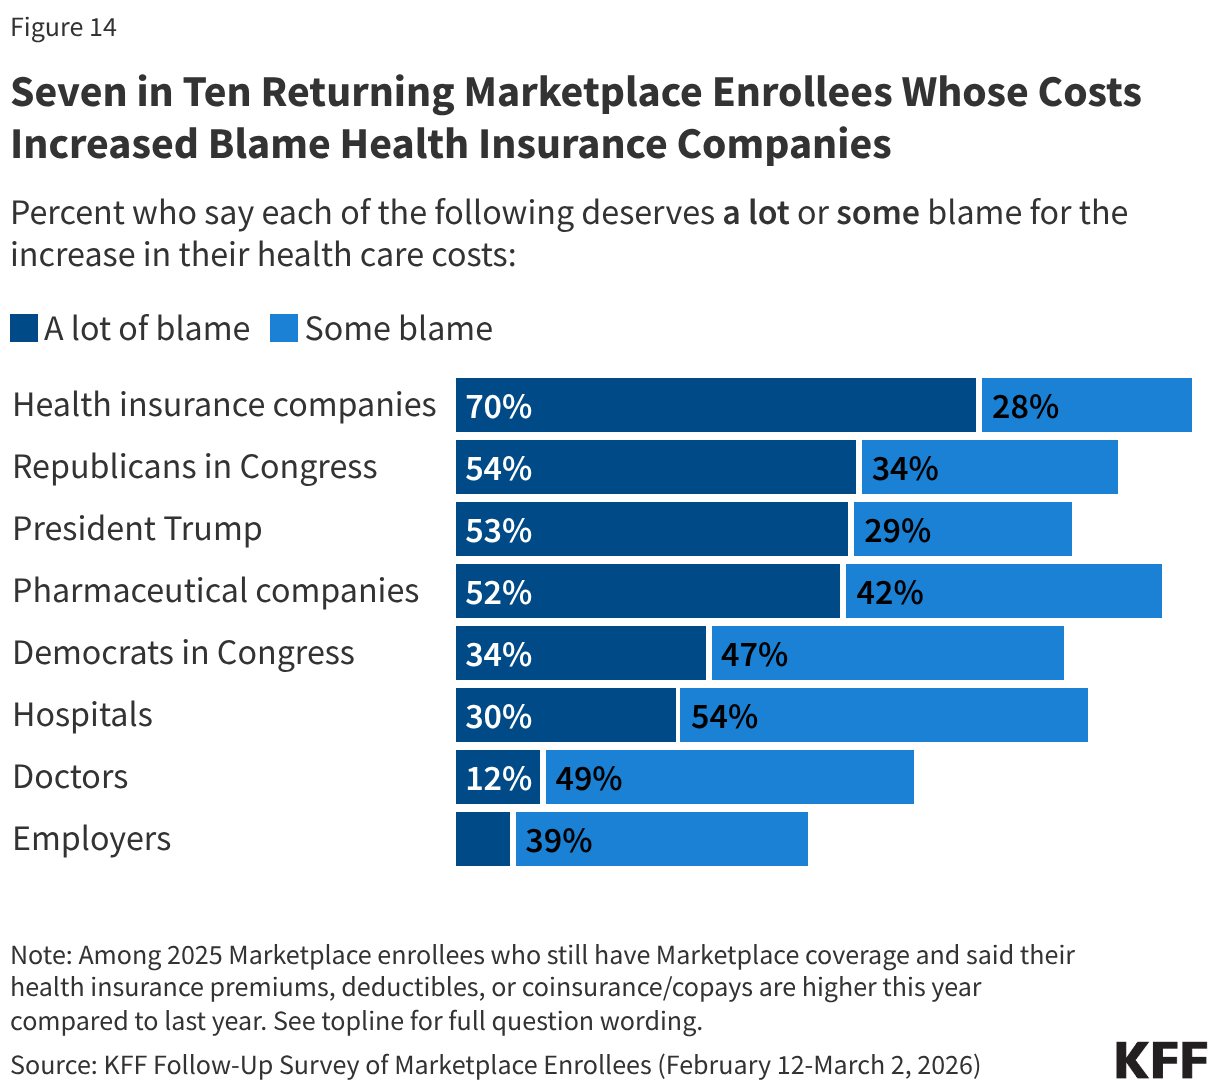
When it comes to increases in their own health care costs, returning Marketplace enrollees blame lawmakers alongside health insurance and pharmaceutical companies.
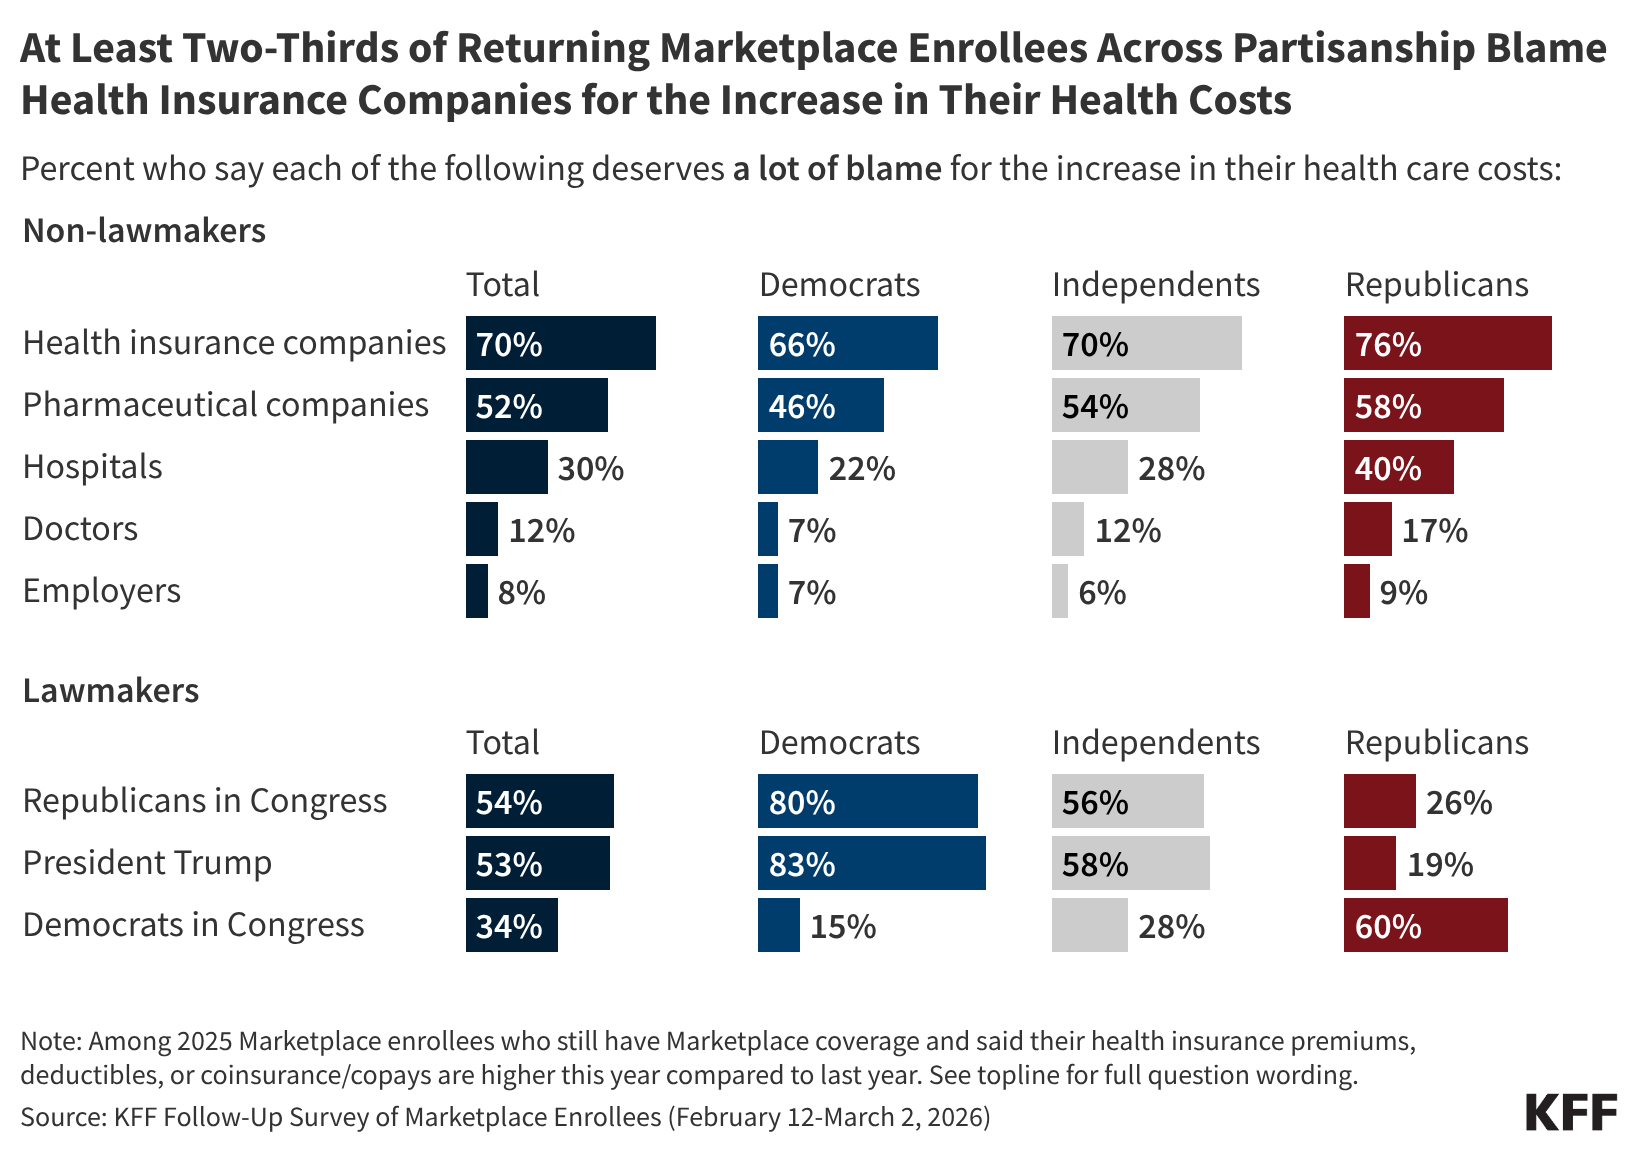
Among the eight in ten returning Marketplace enrollees who say their premiums or cost-sharing are higher this year, seven in ten say health insurance companies deserve “a lot” of blame for the increase. Although the public perceive health insurance companies as a major source of blame for their cost increases, lack of action by Congress in extending the tax credits is attributed as the main cause of increases in premiums and other costs according to KFF policy analysis. Majorities of returning Marketplace enrollees also say Republicans in Congress (54%), President Trump (53%), and pharmaceutical companies (52%) deserve “a lot” of blame for the increase in their health care costs. A third (34%) of returning Marketplace enrollees who report having higher health care costs say Democrats in Congress deserve “a lot” of blame. Fewer place “a lot” of blame on hospitals (30%), doctors (12%), or employers (8%). Notably, around half or more of those who report that their premiums, deductibles, or coinsurance and co-pays are higher this year than last year place at least some blame on each of the groups asked about.
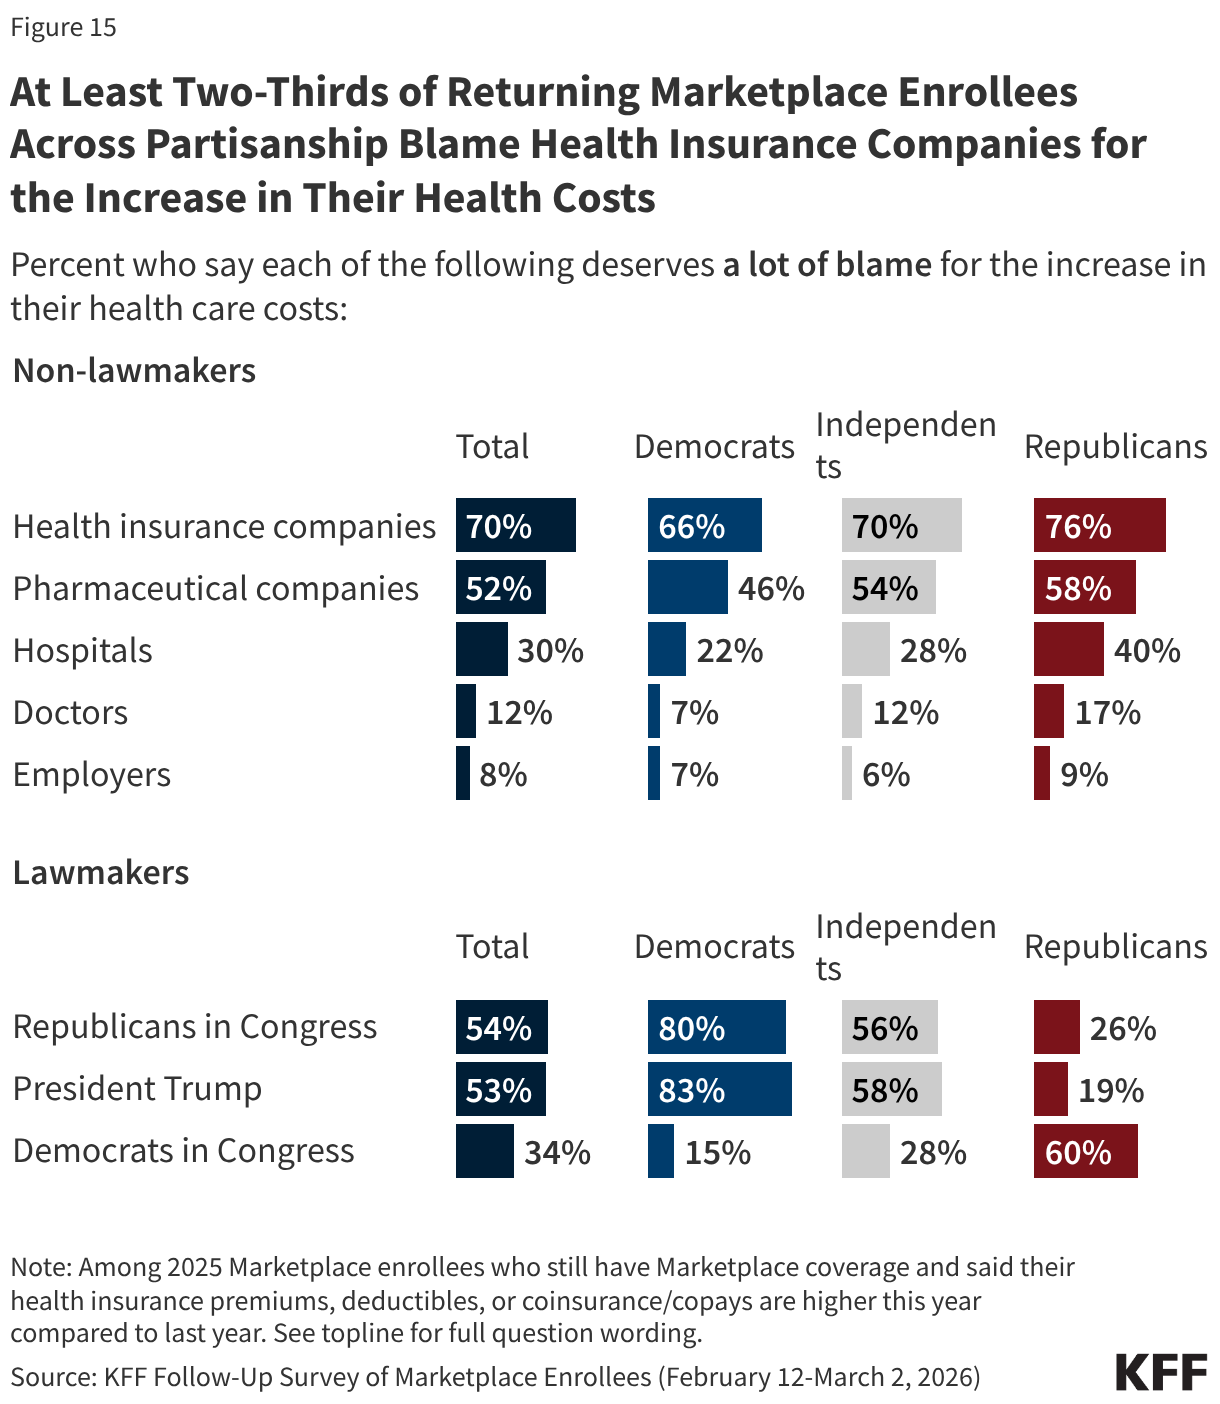
Across partisanship, at least two-thirds of returning Marketplace enrollees whose health care costs (including premiums, deductibles, or coinsurance and co-pays) are higher now than last year say health insurance companies deserve “a lot” of blame, and around half or more place “a lot” of blame for their increased costs on pharmaceutical companies. However, when it comes to lawmakers, there is a predictable partisan division. Among returning Marketplace enrollees with higher health care costs than last year eight in ten or more Democratic enrollees place “a lot” of blame on President Trump (83%) and on Congressional Republicans (80%) for their increased costs. In contrast, six in ten returning Republican enrollees who now have higher health care costs place “a lot” of blame on Democrats in Congress, as do MAGA supporting Republican enrollees.
Health care costs may impact enrollees’ decisions at the ballot box this November, and in some congressional districts, the number of Marketplace enrollees could be enough to swing close elections. Three-quarters of 2025 Marketplace enrollees who are registered to vote say the cost of health care will have a “major impact” or “minor impact” on their decision to vote (73%) and which party’s candidate they will support (74%) in the midterm elections. Majorities of voters across partisanship say health care costs will impact their voting decisions, however Democrats are more than twice as likely as Republicans to say it will have a major impact on their decision of whether to vote (67% vs. 27%) and on which party’s candidate they will support (70% vs. 30%). At least four in ten independent voters say that health care costs will have a major impact on their decision to vote (47%) and who they decide to vote for (44%).
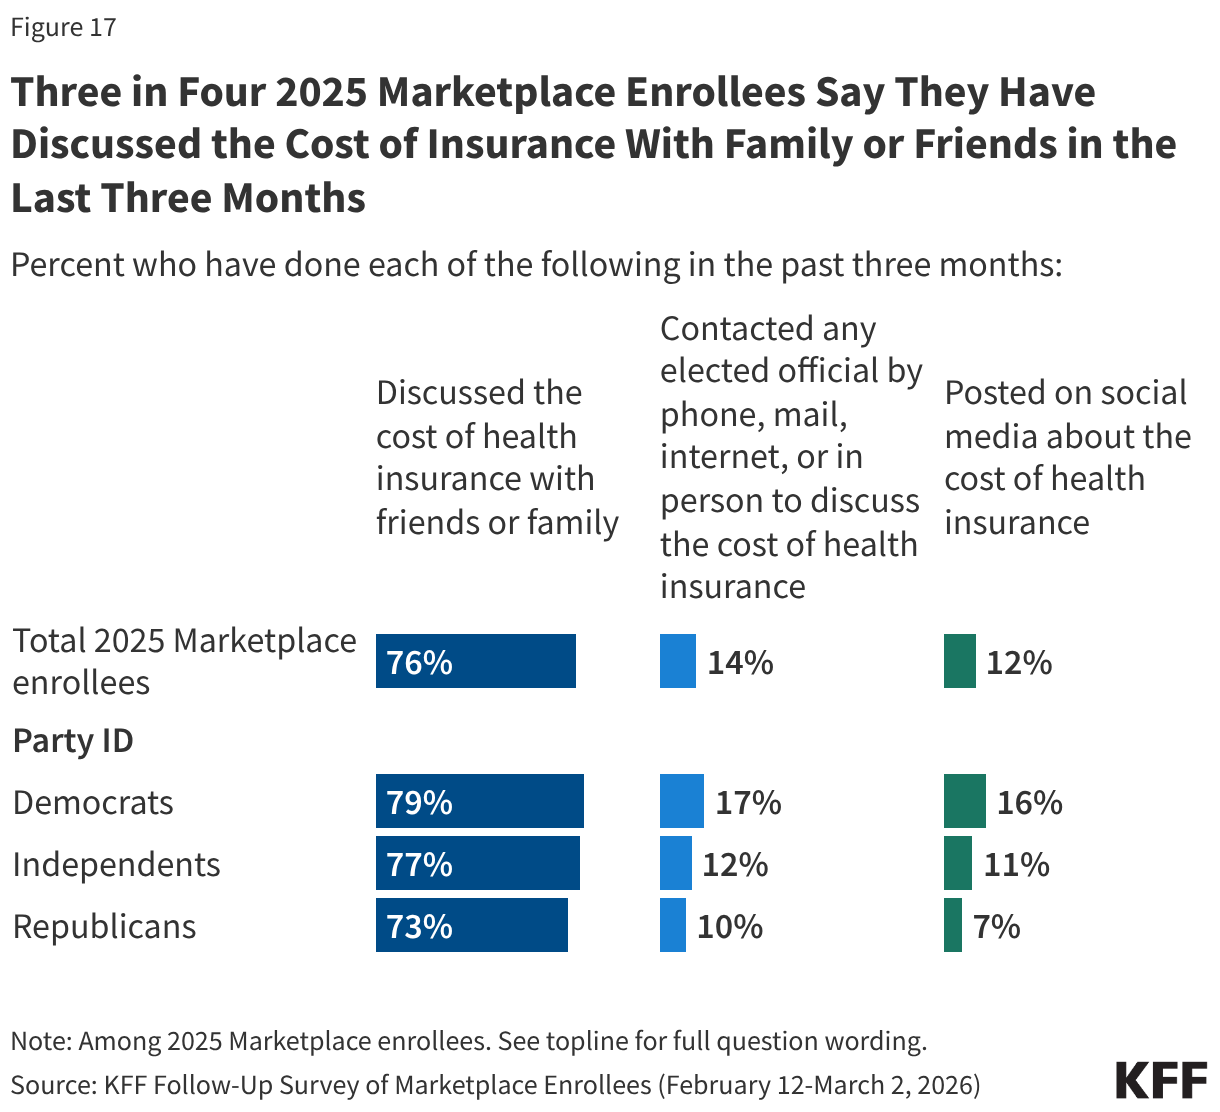
Beyond being motivated to vote, some enrollees have taken actions to discuss their rising health care costs with friends and family, online, or by directly contacting an elected official. Three-quarters (76%) of 2025 Marketplace enrollees have discussed the cost of health insurance with friends or family, including similar shares across partisanship. However, few report taking further action, including one in seven (14%) who have contacted an elected official by phone, mail, internet, or in person to discuss the cost of health insurance and one in nine (12%) who have posted on social media about the cost of health insurance.
Democrats are more likely than Republicans to say they have contacted an elected official (17% vs. 10%) or have posted on social media about the cost of their coverage (16% vs. 7%).
Following the expiration of the enhanced premium tax credits for people with Affordable Care Act (ACA) Marketplace plans, a new KFF follow-up survey of the same Marketplace enrollees KFF surveyed in 2025 finds half (51%) of returning enrollees say their health care costs are “a lot higher” this year compared to last year, including four in 10 who specifically say their premiums are “a lot higher.” In all, a large majority (80%) of these enrollees say their health care costs, which can include premiums, deductibles, co-pays, or coinsurance, are higher.
This new survey, which was fielded about a month after open enrollment ended in most states and before the grace period to make payments ends for many enrollees, re-interviewed Marketplace enrollees who shared their expectations for their coverage decisions late last year. It also finds that nearly one in six (17%) returning ACA Marketplace enrollees say they are not confident they will be able to afford their premiums this year. For those who kept the same Marketplace plans, the expiration of the ACA’s enhanced premium tax credits in 2025 is estimated to have increased annual premium payments by more than two-fold on average this year.
Responding to Rising Health Costs Among those who re-enrolled in an ACA Marketplace plan, a majority (55%) say they have cut or plan to cut spending on food or other basic household expenses to afford their health care costs. The impact is even greater for those with chronic health conditions, more than six in 10 (62%) of whom say they are, or will be, cutting back on food and other basics.
Marketplace enrollees are also concerned about their ability to pay for both routine and unexpected medical expenses. About three in four (73%) returning Marketplace enrollees say they are “very worried” or “somewhat worried” about being able to afford costs for emergency care or hospitalizations while about half are worried about affording costs for routine medical visits (49%) or prescription drugs (45%).
“The impacts on Marketplace enrollees we see in this follow-up survey will likely get worse as people struggle to make payments and the grace period many have expires,” KFF President and CEO Drew Altman said.
For some, rising costs have already forced them to make tough choices. About one in 10 (9%) Marketplace enrollees dropped their ACA coverage and are now uninsured and another nearly three in 10 (28%) changed Marketplace plans. When asked why they decided to drop or change their coverage, most cited costs.
A 63-year-old man in California describes why he is uninsured now: “The end of ACA subsidies caused a huge increase in premiums, the cost of which I could not afford.”
A 56-year-old man in Texas explains why he switched to a different Marketplace plan: “Income exceeded the subsidy limit, forcing us to pay the full cost, so we switched down to a bronze from a gold plan. Even doing that our premiums are 3 times what they were in 2025, with lower plan features and a higher deductible.”
In all, seven in 10 (69%) of those who had ACA Marketplace coverage in 2025 have re-enrolled in a plan through the Marketplace, while others became eligible for different types of health insurance coverage either through an employer (5%) or through Medicare (4%) or Medicaid (7%). A small share (5%) purchased health plans outside of the ACA Marketplace, which typically provide less comprehensive coverage and have fewer consumer protections than Marketplace plans. Even in years with few policy changes, shifts across Marketplace plans or to other types of coverage are normal and often follow changes in employment, income, age, and other life circumstances.
Looking Ahead to the Midterms Among returning Marketplace enrollees who saw higher health costs, seven in 10 (70%) blame health insurance companies “a lot” for their increased costs and at least half place “a lot” of blame on congressional Republicans (54%), President Trump (53%), or pharmaceutical companies (52%). While majorities of partisans place “a lot” of blame on lawmakers from the opposite party, independents with Marketplace coverage are more likely to say Congressional Republicans (56%) and President Trump (58%) deserve “a lot” of blame than Congressional Democrats (28%).
Three-quarters of those who had Marketplace coverage in 2025 and are registered to vote say health care costs will affect their decision to vote (73%) and which party’s candidate they will support (74%). Democrats are more than twice as likely as Republicans to say it will have a major impact on their decision to vote (67% vs. 27%) and which candidate they may support (70% vs. 30%). Among independent voters, nearly half say the issue will have a major impact on their decision to vote (47%) and which candidate they will support (44%).
Designed and analyzed by public opinion researchers at KFF, this survey, which builds on a 2025 survey of ACA Marketplace enrollees, re-interviewed more than 80% of the original sample to learn how they are navigating changes to the ACA Marketplace. The survey was conducted February 12-March 2, 2026, online and by telephone, in English and in Spanish, among a nationally representative sample of 1,117 U.S. adults who had ACA Marketplace coverage in 2025 and completed the initial KFF survey. The margin of sampling error is plus or minus four percentage points for the full sample. For results based on other subgroups, the margin of sampling error may be higher.
Health care affordability is top of mind for many Americans, rising well above other necessities based on recent KFF polling.
A new Peterson-KFF policy explainer lays out the health care trends shaping the 2026 policy debates, including rising premiums, spending on prescription drugs, health care price transparency and consolidation, artificial intelligence in health care, and Medicaid funding cuts and other key program changes.
This brief is available through the Peterson-KFF Health System Tracker, an online information hub dedicated to monitoring and assessing the performance of the U.S. health system.
Costs are the health care problem that most worry the American people. But nothing makes American health care consumers more frustrated using the health system than prior authorization review. I know because they told us that, ranking prior authorization review far ahead of any other problems they have getting care and navigating the health care system, including getting appointments and understanding their bills. Four in 10 people with chronic conditions say it’s their single biggest burden getting health care.
Take Medicare Advantage plans as a case in point. In 2024, they did 53 million prior authorization reviews, almost two per enrollee, turning down 7% of them. You know what it can take to get approvals. Often, countless phone calls and messages in apps to your insurance company and doctor’s office, ending up in some cases with a “peer-to-peer” review between the doctor and the insurance company (are they “peers” in this relationship?). Stress. Delay. Sometimes hours on the phone or days waiting for a call back. And sometimes, the result is an approval only to discover that the venue is denied or out of network, or the quantity of a drug the patient has taken for years requires a separate annual prior approval. The problem isn’t limited to Medicare Advantage, it’s common throughout the insurance system, except for traditional Medicare (more on that below).
Health professionals also dislike prior authorization, especially specialists who order more expensive tests and procedures and have to run the gauntlet of the prior authorization process to get them approved. Their administrative staff does battle daily with insurance company staff over them. More and more, provider AIs and insurance company AIs try to outmaneuver one another over reviews. Everyone thinks they are holy in this tug of war: the doctors who see the insurance companies as greedy profiteers trespassing on their professional judgment, and the insurers who see themselves as the line of defense against doctors who often don’t follow guidelines for best practices or have a financial stake in doing more in a fee-for-service system.
There is some disagreement about whether prior authorization review reduces costs for payers and protects quality by denying unnecessary services or shifting care to equally effective, lower-cost services, or whether it increases costs and leads to adverse outcomes over time by delaying or denying needed care, and studies are available to support either claim. This is not the place for a literature review, except to say prior authorization can and does do both. There should be no debate, however, that it adds to the complexity of our health system, frustrates patients and providers, and drives up administrative costs.
The assumption has been that we are stuck with this. Payers have few tools to control costs in our system, and prior authorization is one of them. But with such profound public angst about it, it’s time to ask if it’s worth the tradeoffs.
Current efforts to change prior authorization review focus on incremental reforms aimed at making it less onerous. States have introduced a range of reforms to streamline prior authorization review, exempting physicians with good track records from review, suspending prior authorization for ongoing care for some people with chronic conditions, requiring that physicians double-check reviews made by insurance company AIs, and more. The Trump administration has joined the fray, too, announcing a voluntary effort with big health insurance companies to speed up and simplify prior authorization review, including reforms that promise to cut back on what is reviewed and how often. We should begin to see how real this voluntary effort is this year.
The bigger question, though, is: could we get rid of prior authorization entirely? I can’t think of anything that would be more politically popular for a candidate planning a midterm or 2028 platform on health, although debate about whether premiums would rise, fueled by insurers, could reduce enthusiasm somewhat.
One approach I used to discuss with my friend, the late Uwe Reinhardt, the great health economist and a frequent critic of insurance companies, was to take prior authorization review out of the hands of insurance companies altogether, setting up independent nonprofit physician-led organizations to take over the job. That would remove the incentive insurance companies have in the current system to put profits over patients. It is, however, trading one big and already established corporate bureaucracy for an entirely new nonprofit one that would have to be constructed and funded across the country (I assume it could be funded mostly by a tithe on health plans much like ACA Marketplaces are).
As health policy historians among us will know, we tried something like that years ago and while it didn’t operate as prior authorization does today, the experience was instructive. It was called the Professional Standards Review Organization (PSRO) Program, and it was administered by CMS (then HCFA) through its Health Standards and Quality Bureau. PSROs—physician-led nonprofit organizations across the country funded by Congress—attempted to control costs by reviewing hospital admissions and hospital stays, with a negative determination resulting in denial of reimbursement by Medicare or Medicaid. Eventually, the program was deemed to cost more than it saved and was repealed in 1982, when the focus shifted generally from costs to quality in a more anti-regulatory environment.
Another approach would be to follow traditional Medicare, which doesn’t do prior authorization review except in very limited cases. Insurers will be quick to argue that premiums will rise even more without prior authorization review. They may be right, even if it also drives up costs for the health system in the long run by delaying and denying some needed care and adding administrative costs. One study by Milliman, which I discussed in an earlier column, calculated the ranges for potential premium increases. It’s also possible that prior authorization has a deterrent effect on physicians and hospitals just by being there, which no one has calculated.
But it’s non-trivial that traditional Medicare has operated almost entirely without prior authorization review. Only recently did the Trump administration—some would say counter intuitively with prior authorization now so unpopular—decide to experiment with introducing it through a demonstration project called WISeR, the Wasteful and Inappropriate Service Reduction Model, to test out prior authorization for selected services in six states. WISeR reviews, perhaps surprisingly given public distrust, are mostly to be driven by AI, which is considered a virtue by its proponents.
Medicare was able to get by without prior authorization largely by paying providers considerably less than private insurance pays them, rather than by reviewing every procedure, test, or prescription to try to manage costs. It suggests a Medicare-like approach as one option: eliminate prior authorization review in return for a reduction in payments to providers (say 2%, for the sake of illustration). In effect, it would constitute a bargain, trading modestly lower payments for greater professional autonomy and lower administrative costs for physicians. It could be tried on a voluntary basis by a big self- insured employer, through a public program or systemwide. I am not sure if providers would welcome the deal or not. The burdens of prior authorization review do not fall equally on all practices and providers. I do know that, depending on which kinds of physicians are surveyed, between a third and half of physicians say they would not enter medicine if they had it to do over again, largely because of the perceived loss of professional autonomy. Hospitals would mainly benefit from reduced administrative costs and could have less interest. The idea would not be simple to implement.
Any move away from fee-for-service payment could also diminish the need for prior authorization review by reducing the incentive to provide more services. In integrated systems like Kaiser Permanente (no connection to KFF), doctors on salary don’t have a financial incentive to provide more care and the medical group they are part of makes the judgments about evidence-based care.
Every health policy change has tradeoffs. There are only so many tools payers have now to throw at health care costs, and prior authorization is one of them. But in a health system plagued as much by complexity as high costs, it is now public enemy number one for health care consumers, especially consumers who become patients and need a lot of care. The serious question we are not asking is whether the benefits it has for short-term cost control for insurers and their clients are worth the costs to patients and health professionals in an already labyrinthian health care system?
So, the big question: with all the tradeoffs, would you get rid of prior authorization review, or stick with the path we are on now, incrementally trying to make it slightly better?
For people who buy their own health insurance, premiums rose significantly in 2026 after Congress failed to extend federal subsidy enhancements that expired at the end of 2025. Stories of consumers facing unaffordable health insurance premiums are widespread. You’re not alone if you feel like you can’t afford health insurance.
Why you might not qualify for Medicaid
We’ll discuss private health insurance in a moment, but if health coverage feels unaffordable and you’re also not eligible for Medicaid, you might have wondered why you can’t enroll in Medicaid. There are a few reasons this might be the case:
You might be in a state that hasn’t expanded Medicaid under the ACA (more about that below).
Your income might be above the eligibility cut off for Medicaid.
You might be a recent (within the last five years) immigrant.
Your kids might be Medicaid/CHIP-eligible but you might not be, because the income limits are higher for kids.
Now let’s take a look at a few scenarios to explain why you might be facing unaffordable health insurance premiums, and what you might be able to do about it.
Scenario 1: You earn too much to qualify for a subsidy
The “subsidy cliff” returned in 2026, due to the expiration of the federal subsidy enhancements. This means that federal premium subsidies (premium tax credits) are no longer available to Marketplace enrollees with household income above 400% of the federal poverty level (FPL), regardless of how expensive their coverage options are. (Note that state-funded subsidies do extend above 400% of FPL in Connecticut, New Jersey, and New Mexico.)
What can you do to qualify for subsidies?
If you lost your subsidy altogether at the end of 2025, it’s likely because your household ACA-specific Modified Adjusted Gross Income (MAGI) is over 400% of FPL. (For 2026 coverage in the continental United States, that means you earn more than $62,600 for a single person, or more than $128,600 for a family of four).
Eligibility for a federal Marketplace premium tax credit requires that a household’s Modified Adjusted Gross Income (MAGI) be at or below 400% of the Federal Poverty Level (FPL). Depending on how far above this threshold your projected income is, it may be possible to bring your MAGI within the required range. This is generally done in one of two ways:
Adjusting projected income if you are working fewer hours, taking on fewer clients, or otherwise earning less.
If you’re not subsidy-eligible and you prefer a Silver plan, you might consider an off-exchange plan. These are ACA-compliant individual-market policies, but in most states, full-price Silver plans are less expensive off-exchange than on-exchange. This is because the cost of cost-sharing reductions is added to the premiums for on-exchange Silver plans in most states.
Premium subsidies are not available for off-exchange plans. But if you’re not eligible for subsidies due to your income, you won’t be giving up anything by opting for an off-exchange plan. (“Off-exchange” refers to fully ACA-compliant individual-market plans, and does not include non-ACA-compliant plans. Those are addressed in more detail below.)
If you prefer a Bronze or Gold plan, the full-price premiums for those plans are generally the same on-exchange or off-exchange because there are no CSRs impacting the price on or off exchange. But depending on where you live, there may be insurers that offer coverage only on-exchange or only off-exchange. So if you’re not subsidy-eligible, a comprehensive comparison of both on-exchange and off-exchange plans will give you a full picture of what’s available in your area.
(Regardless of whether you’re shopping on-exchange or off-exchange, you can complete the process yourself or do it with help from a broker, which won’t cost you anything.)
Scenario 2: You qualify for subsidies, but coverage still seems unaffordable
You’re certainly not alone if you’re in this category. Most Marketplace enrollees are still eligible for subsidies in 2026, but after-subsidy premiums were projected to more than double in 2026, due to the expiration of the subsidy enhancements at the end of 2025.
As noted above, enrollees with household income above 400% of FPL lost their subsidies altogether at the end of 2025, resulting in substantial premium increases. But even for those who still qualify for subsidies, the subsidies now cover a smaller share of enrollees’ total premiums. To continue to have Marketplace coverage in 2026, these enrollees must either pay higher premiums, downgrade their coverage, or both.
KFF surveyed Marketplace enrollees in November 2025, asking what they would do when confronted with net premiums that were more than doubling. More than half indicated that they would either select a plan with lower premiums but higher deductibles and co-pays, or drop their coverage altogether.
If your coverage feels unaffordable even with subsidies, there are a couple of options to make it more affordable:
Reduce MAGI. As long as your MAGI stays above the Medicaid eligibility threshold in your state (and doesn’t drop below 100% of FPL), a lower MAGI will result in a larger subsidy. You can use a subsidy calculator to see how changes in your MAGI will affect the size of your subsidy.
Downgrade to a plan with a lower premium. Several state-run Marketplaces have published data on 2026 plan selections, and there was a clear trend towards higher enrollment in Bronze plans (which have higher out-of-pocket costs but lower premiums than Silver or Gold plans). But at this point, most current enrollees won’t have an opportunity to change their coverage for the rest of the year, as open enrollment for 2026 has ended and most special enrollment periods limit current enrollees to a different plan at the same metal level as their current plan.
Scenario 3: You’re in the coverage gap
The coverage gap is not new in 2026. It has always existed in nine states that haven’t expanded Medicaid as called for in the ACA: Alabama, Florida, Georgia, Kansas, Mississippi, South Carolina, Tennessee, Texas, and Wyoming. Because those states have chosen not to expand Medicaid, many adult residents with income below the federal poverty level are not eligible for any financial assistance with their health coverage and are not eligible for Medicaid.
What can you do to qualify for financial assistance?
If you’re an adult in one of those nine states and your income is below the federal poverty level, you’re not eligible for Marketplace subsidies. You may find that you’re not eligible for Medicaid either (unless you’re pregnant or the parent of a minor child, although Medicaid income rules for this vary by state).
To become eligible for Marketplace subsidies, you would need an ACA-specific modified adjusted gross income (MAGI) of at least 100% of the prior year’s FPL.
For 2026 coverage, that’s $15,650 for a single adult, or $21,150 for a household of two.
Note: If you’re in a coverage gap state and you enter an income below the FPL on the Marketplace plan comparison tool, it will tell you that you aren’t subsidy eligible, but it won’t tell you why. The reason is that your income is below the FPL.
Medicaid eligibility varies by state, with the states that expanded Medicaid eligibility under the Affordable Care Act covering a much greater portion of the low-income adult population. If you’re affected by the coverage gap, you may find that you’d actually be eligible for Medicaid if you lived in one of your neighboring states.
Starting in 2027, Medicaid recipients in expansion states will face a work requirement (nationwide), which will require at least 80 hours per month of work or other community engagement.
Scenario 4: You cannot afford ACA-compliant health insurance
If you’ve tried all of the above strategies and can’t make an ACA-compliant health plan work with your budget, you may have already dropped your coverage or be planning to do so soon.
There are some additional coverage options you may consider, which might be better than going without any coverage at all. None of these alternatives is regulated by the ACA. Some aren’t considered insurance at all, and thus aren’t subject to a state’s insurance laws. Because these plans aren’t ACA-compliant, they don’t have to cover the essential health benefits, typically exclude pre-existing conditions, and generally have annual and lifetime benefit caps. But depending on your circumstances and budget, they may pay for some health care costs that you would otherwise pay entirely out-of-pocket if you had no coverage at all. It’s important to review the plan details thoroughly before making a decision.
Non-ACA-compliant insurance options
These include short-term health insurance, fixed–indemnity plans, and various types of supplemental coverage such as accident insurance and critical illness insurance. Short-term health insurance availability varies by state: In some states there are no plans available, while in others there are plans available with total durations of up to three years, including renewals. None of these plans are considered comprehensive coverage under the ACA.
Non-ACA-compliant options that aren’t considered insurance
The specific benefits vary from one plan to another. But since these types of coverage are not considered insurance, consumers who have problems with them cannot turn to the state insurance department for assistance.
Almost all hospital emergency departments are required to assess and stabilize patients regardless of their ability to pay. But the hospital can still bill you for the care you receive in the emergency department.
How to get help finding coverage
There are people online, on the phone, and in your community who can help you with the process of getting health coverage. You don’t have to pay anything for their assistance, as premiums are the same whether you have assistance or take a DIY approach. Here’s an overview of the help that’s available to you:
Agents and brokers can help with on-exchange or off-exchange plans. They receive a commission from the insurance carrier if they enroll you in a plan, but it doesn’t affect the price you pay.
The Marketplace call center can answer questions and help with enrollment. If you’re in a state that uses HealthCare.gov, the number is 1-800-318-2596. If you’re in a state that runs its own exchange (20 states plus DC), there will be a state-run call center.
The “find local help” tool on HealthCare.gov will let you see agents, brokers, Navigators, and CACs in your area. State-run Marketplaces have similar tools.
Dial 211. If you aren’t sure where to turn, calling 211 will get you to a local or regional call center that can connect you to helpful health coverage resources.
Louise Norris is an individual health insurance broker who has been writing about health insurance and health reform since 2006. She has written hundreds of opinions and educational pieces about the Affordable Care Act for healthinsurance.org.